
|
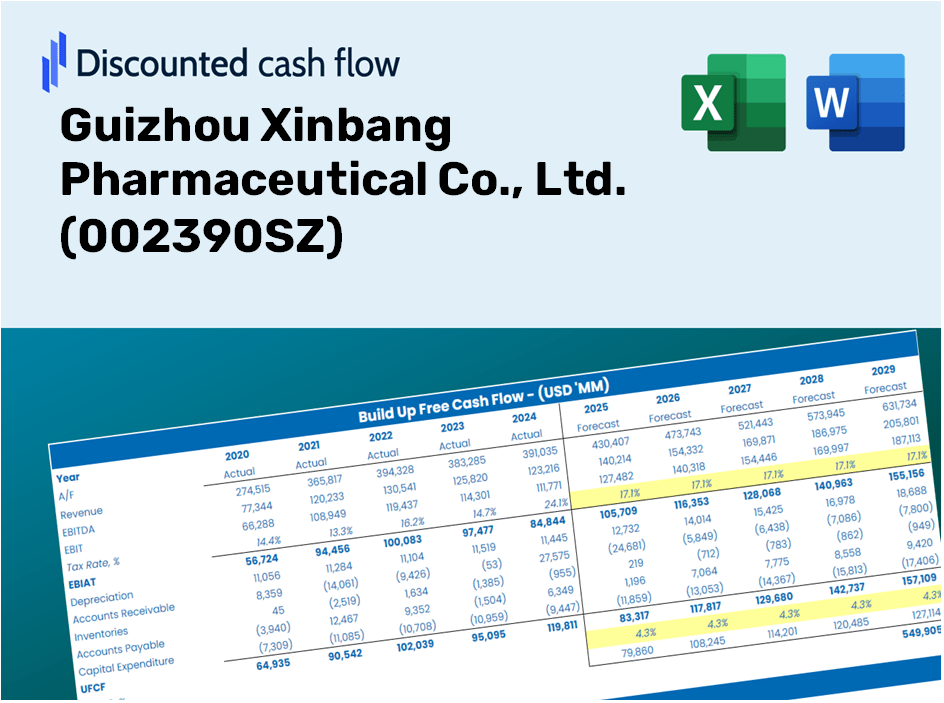
Guizhou Xinbang Pharmaceutical Co., Ltd. (002390.sz) DCF -Bewertung |
Fully Editable: Tailor To Your Needs In Excel Or Sheets
Professional Design: Trusted, Industry-Standard Templates
Investor-Approved Valuation Models
MAC/PC Compatible, Fully Unlocked
No Expertise Is Needed; Easy To Follow
Guizhou Xinbang Pharmaceutical Co., Ltd. (002390.SZ) Bundle
Vereinfachen Sie Guizhou Xinbang Pharmaceutical Co., Ltd. (002390SZ) Bewertung mit diesem anpassbaren DCF -Taschenrechner! Mit Real Guizhou Xinbang Pharmaceutical Co., Ltd. (002390SZ) Finanzdaten und einstellbaren Prognose -Inputs können Sie Szenarien testen und Guizhou Xinbang Pharmaceutical Co., Ltd. (002390SZ) fairen Wert in Minuten.
Discounted Cash Flow (DCF) - (USD MM)
| Year | AY1 2020 |
AY2 2021 |
AY3 2022 |
AY4 2023 |
AY5 2024 |
FY1 2025 |
FY2 2026 |
FY3 2027 |
FY4 2028 |
FY5 2029 |
|---|---|---|---|---|---|---|---|---|---|---|
| Revenue | 5,845.6 | 6,471.9 | 6,350.0 | 6,460.8 | 6,032.3 | 6,091.7 | 6,151.7 | 6,212.4 | 6,273.6 | 6,335.4 |
| Revenue Growth, % | 0 | 10.71 | -1.88 | 1.75 | -6.63 | 0.98552 | 0.98552 | 0.98552 | 0.98552 | 0.98552 |
| EBITDA | 635.3 | 767.4 | 567.9 | 619.7 | 491.1 | 601.9 | 607.8 | 613.8 | 619.8 | 626.0 |
| EBITDA, % | 10.87 | 11.86 | 8.94 | 9.59 | 8.14 | 9.88 | 9.88 | 9.88 | 9.88 | 9.88 |
| Depreciation | 231.6 | 238.9 | 235.1 | 228.7 | 208.2 | 223.5 | 225.7 | 228.0 | 230.2 | 232.5 |
| Depreciation, % | 3.96 | 3.69 | 3.7 | 3.54 | 3.45 | 3.67 | 3.67 | 3.67 | 3.67 | 3.67 |
| EBIT | 403.6 | 528.6 | 332.8 | 391.0 | 282.8 | 378.4 | 382.1 | 385.8 | 389.6 | 393.5 |
| EBIT, % | 6.9 | 8.17 | 5.24 | 6.05 | 4.69 | 6.21 | 6.21 | 6.21 | 6.21 | 6.21 |
| Total Cash | 1,776.4 | 624.6 | 899.2 | 806.0 | 1,015.5 | 1,017.4 | 1,027.5 | 1,037.6 | 1,047.8 | 1,058.1 |
| Total Cash, percent | .0 | .0 | .0 | .0 | .0 | .0 | .0 | .0 | .0 | .0 |
| Account Receivables | 2,666.3 | 3,678.8 | 3,537.1 | 3,036.5 | 3,005.1 | 3,106.4 | 3,137.1 | 3,168.0 | 3,199.2 | 3,230.7 |
| Account Receivables, % | 45.61 | 56.84 | 55.7 | 47 | 49.82 | 50.99 | 50.99 | 50.99 | 50.99 | 50.99 |
| Inventories | 843.4 | 935.7 | 1,032.7 | 1,000.8 | 1,060.4 | 953.0 | 962.4 | 971.8 | 981.4 | 991.1 |
| Inventories, % | 14.43 | 14.46 | 16.26 | 15.49 | 17.58 | 15.64 | 15.64 | 15.64 | 15.64 | 15.64 |
| Accounts Payable | 788.6 | 993.4 | 977.2 | 903.2 | 928.0 | 896.6 | 905.4 | 914.4 | 923.4 | 932.5 |
| Accounts Payable, % | 13.49 | 15.35 | 15.39 | 13.98 | 15.38 | 14.72 | 14.72 | 14.72 | 14.72 | 14.72 |
| Capital Expenditure | -138.1 | -253.8 | -158.8 | -135.8 | -124.9 | -157.8 | -159.4 | -161.0 | -162.6 | -164.2 |
| Capital Expenditure, % | -2.36 | -3.92 | -2.5 | -2.1 | -2.07 | -2.59 | -2.59 | -2.59 | -2.59 | -2.59 |
| Tax Rate, % | 45.35 | 45.35 | 45.35 | 45.35 | 45.35 | 45.35 | 45.35 | 45.35 | 45.35 | 45.35 |
| EBITAT | 261.9 | 342.5 | 238.3 | 283.6 | 154.6 | 248.5 | 251.0 | 253.5 | 256.0 | 258.5 |
| Depreciation | ||||||||||
| Changes in Account Receivables | ||||||||||
| Changes in Inventories | ||||||||||
| Changes in Accounts Payable | ||||||||||
| Capital Expenditure | ||||||||||
| UFCF | -2,365.7 | -572.3 | 343.0 | 835.0 | 234.5 | 289.0 | 286.1 | 289.0 | 291.8 | 294.7 |
| WACC, % | 5.47 | 5.47 | 5.5 | 5.5 | 5.44 | 5.47 | 5.47 | 5.47 | 5.47 | 5.47 |
| PV UFCF | ||||||||||
| SUM PV UFCF | 1,239.0 | |||||||||
| Long Term Growth Rate, % | 3.00 | |||||||||
| Free cash flow (T + 1) | 304 | |||||||||
| Terminal Value | 12,265 | |||||||||
| Present Terminal Value | 9,395 | |||||||||
| Enterprise Value | 10,634 | |||||||||
| Net Debt | -242 | |||||||||
| Equity Value | 10,877 | |||||||||
| Diluted Shares Outstanding, MM | 1,896 | |||||||||
| Equity Value Per Share | 5.74 |
What You Will Receive
- Authentic 002390SZ Financial Data: Pre-filled with Guizhou Xinbang Pharmaceutical’s historical and projected figures for accurate analysis.
- Customizable Template: Effortlessly adjust key inputs such as revenue growth, WACC, and EBITDA percentage.
- Instant Calculations: Watch the intrinsic value of Guizhou Xinbang Pharmaceutical update in real-time as you make changes.
- Expert Valuation Tool: Tailored for investors, analysts, and consultants in need of precise DCF results.
- Intuitive Design: Clear layout and straightforward instructions suitable for all skill levels.
Highlighted Features
- Comprehensive Financial Insights: Gain access to precise historical data and forward-looking projections for Guizhou Xinbang Pharmaceutical Co., Ltd. (002390SZ).
- Flexible Forecast Inputs: Modify the yellow-highlighted fields such as discount rates, growth projections, and profit margins.
- Real-Time Calculations: Automatic updates for DCF, Net Present Value (NPV), and cash flow assessments.
- User-Friendly Dashboard: Intuitive charts and summaries designed to clearly present your valuation findings.
- Suitable for All Skill Levels: A straightforward and accessible layout tailored for investors, CFOs, and consultants alike.
How It Works
- Step 1: Download the ready-to-use Excel template featuring Guizhou Xinbang Pharmaceutical Co., Ltd.'s (002390SZ) data.
- Step 2: Navigate through the pre-populated sheets to familiarize yourself with the essential metrics.
- Step 3: Adjust forecasts and assumptions in the editable yellow cells (WACC, growth rates, and profit margins).
- Step 4: Instantly see the updated results, including the intrinsic value of Guizhou Xinbang Pharmaceutical Co., Ltd. (002390SZ).
- Step 5: Utilize the outputs to make well-informed investment choices or create comprehensive reports.
Why Opt for This Calculator?
- Designed for Experts: A sophisticated tool tailored for analysts, CFOs, and consultants.
- Accurate Data: Guizhou Xinbang Pharmaceutical Co., Ltd.'s historical and projected financials are preloaded for precision.
- Versatile Scenario Testing: Easily simulate various forecasts and assumptions.
- Clear Results: Automatically computes intrinsic value, NPV, and essential metrics.
- User-Friendly: Step-by-step guidance simplifies the entire process.
Who Can Benefit from Guizhou Xinbang Pharmaceutical Co., Ltd. (002390SZ)?
- Investors: Make informed decisions backed by a reliable valuation tool tailored for the pharmaceutical industry.
- Financial Analysts: Streamline your analysis process with a user-friendly DCF model that allows for easy customization.
- Consultants: Effortlessly modify the template for impactful client presentations or detailed reports.
- Pharmaceutical Enthusiasts: Enhance your knowledge of valuation methodologies through practical, real-world insights.
- Educators and Students: Utilize this resource as a hands-on learning aid in pharmaceutical finance courses.
Contents of the Template
- Pre-Filled Data: Contains Guizhou Xinbang Pharmaceutical Co., Ltd.'s historical financial performance and projections.
- Discounted Cash Flow Model: An editable DCF valuation model featuring automated calculations.
- Weighted Average Cost of Capital (WACC): A dedicated worksheet for calculating WACC using tailored inputs.
- Key Financial Ratios: Evaluate Guizhou Xinbang's profitability, operational efficiency, and financial leverage.
- Customizable Inputs: Easily adjust revenue growth rates, profit margins, and tax percentages.
- Clear Dashboard: Visualizations and tables presenting essential valuation outcomes.
Disclaimer
All information, articles, and product details provided on this website are for general informational and educational purposes only. We do not claim any ownership over, nor do we intend to infringe upon, any trademarks, copyrights, logos, brand names, or other intellectual property mentioned or depicted on this site. Such intellectual property remains the property of its respective owners, and any references here are made solely for identification or informational purposes, without implying any affiliation, endorsement, or partnership.
We make no representations or warranties, express or implied, regarding the accuracy, completeness, or suitability of any content or products presented. Nothing on this website should be construed as legal, tax, investment, financial, medical, or other professional advice. In addition, no part of this site—including articles or product references—constitutes a solicitation, recommendation, endorsement, advertisement, or offer to buy or sell any securities, franchises, or other financial instruments, particularly in jurisdictions where such activity would be unlawful.
All content is of a general nature and may not address the specific circumstances of any individual or entity. It is not a substitute for professional advice or services. Any actions you take based on the information provided here are strictly at your own risk. You accept full responsibility for any decisions or outcomes arising from your use of this website and agree to release us from any liability in connection with your use of, or reliance upon, the content or products found herein.