
|
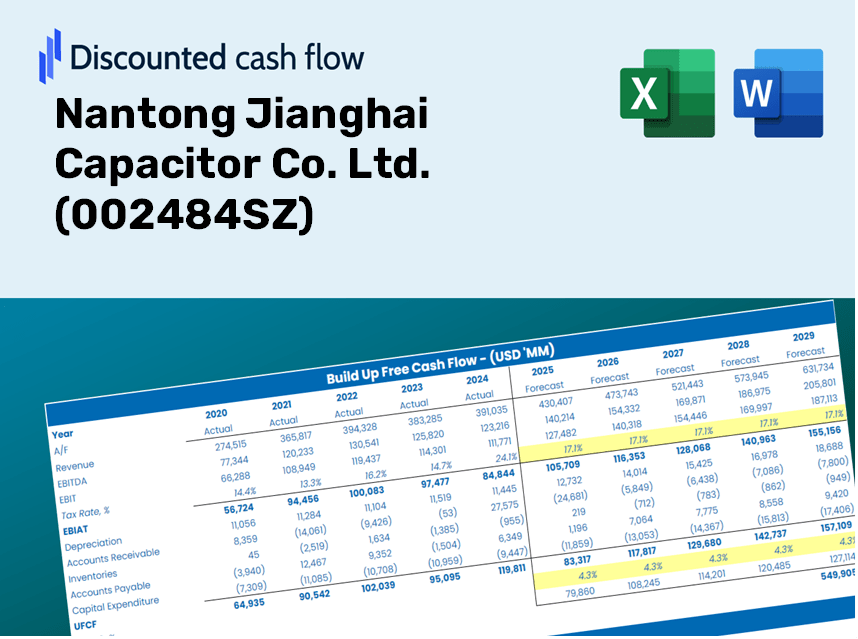
Nantong Jianghai Capacitor Co. Ltd. (002484.SZ) DCF -Bewertung |
Fully Editable: Tailor To Your Needs In Excel Or Sheets
Professional Design: Trusted, Industry-Standard Templates
Investor-Approved Valuation Models
MAC/PC Compatible, Fully Unlocked
No Expertise Is Needed; Easy To Follow
Nantong Jianghai Capacitor Co. Ltd. (002484.SZ) Bundle
Entdecken Sie die finanzielle Zukunft von Nantong Jianghai Capacitor Co. Ltd. (002484SZ) mit unserem benutzerfreundlichen DCF-Taschenrechner! Geben Sie Ihre Prognosen für Wachstum, Margen und Kosten ein, um den inneren Wert von Nantong Jianghai Capacitor Co. Ltd. (002484SZ) zu bestimmen und verfeinern Sie Ihre Anlagestrategie.
Discounted Cash Flow (DCF) - (USD MM)
| Year | AY1 2020 |
AY2 2021 |
AY3 2022 |
AY4 2023 |
AY5 2024 |
FY1 2025 |
FY2 2026 |
FY3 2027 |
FY4 2028 |
FY5 2029 |
|---|---|---|---|---|---|---|---|---|---|---|
| Revenue | 2,635.0 | 3,549.7 | 4,521.7 | 4,844.9 | 4,808.2 | 5,631.3 | 6,595.5 | 7,724.7 | 9,047.2 | 10,596.1 |
| Revenue Growth, % | 0 | 34.71 | 27.38 | 7.15 | -0.75896 | 17.12 | 17.12 | 17.12 | 17.12 | 17.12 |
| EBITDA | 486.2 | 626.0 | 877.4 | 967.6 | 939.9 | 1,070.1 | 1,253.3 | 1,467.8 | 1,719.1 | 2,013.5 |
| EBITDA, % | 18.45 | 17.64 | 19.4 | 19.97 | 19.55 | 19 | 19 | 19 | 19 | 19 |
| Depreciation | 125.8 | 158.8 | 177.2 | 212.7 | 244.7 | 255.1 | 298.7 | 349.9 | 409.8 | 479.9 |
| Depreciation, % | 4.77 | 4.47 | 3.92 | 4.39 | 5.09 | 4.53 | 4.53 | 4.53 | 4.53 | 4.53 |
| EBIT | 360.4 | 467.2 | 700.2 | 754.9 | 695.3 | 815.0 | 954.5 | 1,118.0 | 1,309.4 | 1,533.6 |
| EBIT, % | 13.68 | 13.16 | 15.49 | 15.58 | 14.46 | 14.47 | 14.47 | 14.47 | 14.47 | 14.47 |
| Total Cash | 893.2 | 764.3 | 815.6 | 1,090.4 | 1,304.4 | 1,386.5 | 1,623.8 | 1,901.9 | 2,227.5 | 2,608.8 |
| Total Cash, percent | .0 | .0 | .0 | .0 | .0 | .0 | .0 | .0 | .0 | .0 |
| Account Receivables | 1,176.4 | 1,357.6 | 1,800.7 | 1,965.6 | 2,033.6 | 2,315.4 | 2,711.8 | 3,176.1 | 3,719.8 | 4,356.7 |
| Account Receivables, % | 44.65 | 38.25 | 39.82 | 40.57 | 42.29 | 41.12 | 41.12 | 41.12 | 41.12 | 41.12 |
| Inventories | 683.7 | 852.6 | 1,153.4 | 1,098.4 | 1,030.0 | 1,346.6 | 1,577.2 | 1,847.2 | 2,163.5 | 2,533.9 |
| Inventories, % | 25.95 | 24.02 | 25.51 | 22.67 | 21.42 | 23.91 | 23.91 | 23.91 | 23.91 | 23.91 |
| Accounts Payable | 751.7 | 811.9 | 1,161.2 | 1,120.3 | 1,085.6 | 1,382.8 | 1,619.6 | 1,896.9 | 2,221.7 | 2,602.0 |
| Accounts Payable, % | 28.53 | 22.87 | 25.68 | 23.12 | 22.58 | 24.56 | 24.56 | 24.56 | 24.56 | 24.56 |
| Capital Expenditure | -210.3 | -373.9 | -461.2 | -293.7 | -296.6 | -461.2 | -540.1 | -632.6 | -740.9 | -867.7 |
| Capital Expenditure, % | -7.98 | -10.53 | -10.2 | -6.06 | -6.17 | -8.19 | -8.19 | -8.19 | -8.19 | -8.19 |
| Tax Rate, % | 11.72 | 11.72 | 11.72 | 11.72 | 11.72 | 11.72 | 11.72 | 11.72 | 11.72 | 11.72 |
| EBITAT | 315.1 | 405.7 | 617.6 | 647.9 | 613.8 | 711.7 | 833.5 | 976.2 | 1,143.3 | 1,339.1 |
| Depreciation | ||||||||||
| Changes in Account Receivables | ||||||||||
| Changes in Inventories | ||||||||||
| Changes in Accounts Payable | ||||||||||
| Capital Expenditure | ||||||||||
| UFCF | -877.9 | -99.3 | -61.0 | 416.1 | 527.6 | 204.3 | 201.9 | 236.4 | 276.9 | 324.3 |
| WACC, % | 4.53 | 4.53 | 4.53 | 4.53 | 4.53 | 4.53 | 4.53 | 4.53 | 4.53 | 4.53 |
| PV UFCF | ||||||||||
| SUM PV UFCF | 1,079.2 | |||||||||
| Long Term Growth Rate, % | 3.50 | |||||||||
| Free cash flow (T + 1) | 336 | |||||||||
| Terminal Value | 32,659 | |||||||||
| Present Terminal Value | 26,172 | |||||||||
| Enterprise Value | 27,251 | |||||||||
| Net Debt | -968 | |||||||||
| Equity Value | 28,219 | |||||||||
| Diluted Shares Outstanding, MM | 844 | |||||||||
| Equity Value Per Share | 33.42 |
What You Will Receive
- Accurate 002484SZ Financials: Access to historical and projected data for precise evaluations.
- Customizable Parameters: Adjust WACC, tax rates, revenue growth, and capital expenditures as needed.
- Instant Calculations: Dynamic computation of intrinsic value and NPV at your fingertips.
- Scenario Exploration: Analyze various scenarios to assess Nantong Jianghai's future performance.
- User-Friendly Design: Designed for industry professionals but easy to navigate for newcomers.
Key Features
- Customizable Forecast Parameters: Adjust essential factors like revenue growth, EBITDA percentage, and capital expenses.
- Instant DCF Valuation: Automatically computes intrinsic value, NPV, and other key financial metrics.
- High-Precision Accuracy: Leverages Nantong Jianghai Capacitor Co. Ltd.'s real-world financial data for credible valuation results.
- Effortless Scenario Analysis: Evaluate various assumptions and analyze results with ease.
- Efficiency Boost: Avoid the hassle of constructing intricate valuation models from the ground up.
How It Functions
- Download the Template: Gain immediate access to the Excel-based Nantong Jianghai Capacitor Co. Ltd. (002484SZ) DCF Calculator.
- Input Your Assumptions: Modify the yellow-highlighted cells for growth rates, WACC, profit margins, and additional variables.
- Instant Calculations: The model will automatically update the intrinsic value of Nantong Jianghai Capacitor Co. Ltd. (002484SZ).
- Test Scenarios: Experiment with various assumptions to assess potential changes in valuation.
- Analyze and Decide: Utilize the findings to inform your investment or financial analysis decisions.
Why Choose This Calculator for Nantong Jianghai Capacitor Co. Ltd. (002484SZ)?
- User-Friendly Interface: Perfect for both novice users and seasoned analysts.
- Customizable Inputs: Modify parameters effortlessly to suit your evaluations.
- Real-Time Valuation: Instantly observe changes in Nantong Jianghai’s valuation with input adjustments.
- Preloaded Financial Data: Comes equipped with Nantong Jianghai’s actual financial figures for swift analysis.
- Preferred by Experts: A reliable tool utilized by investors and analysts for informed decision-making.
Who Can Benefit from Nantong Jianghai Capacitor Co. Ltd. (002484SZ)?
- Investors: Leverage our insights to make informed decisions in the capacitor market.
- Financial Analysts: Streamline your analysis with our comprehensive data and accessible financial models.
- Consultants: Easily modify our resources for client reports and presentations tailored to their needs.
- Electronics Enthusiasts: Enhance your knowledge of capacitor technology through real-world applications.
- Academics and Students: Utilize our materials as a valuable educational resource in electronics and finance courses.
Contents of the Template
- Pre-Filled Data: Contains Nantong Jianghai Capacitor Co. Ltd.'s historical financials and projections.
- Discounted Cash Flow Model: An editable DCF valuation model featuring automatic calculations.
- Weighted Average Cost of Capital (WACC): A dedicated section for calculating WACC based on user-defined inputs.
- Key Financial Ratios: Assess Nantong Jianghai's profitability, efficiency, and leverage metrics.
- Customizable Inputs: Easily modify revenue growth, profit margins, and tax rates.
- Clear Dashboard: Visuals and tables that summarize key valuation outcomes.
Disclaimer
All information, articles, and product details provided on this website are for general informational and educational purposes only. We do not claim any ownership over, nor do we intend to infringe upon, any trademarks, copyrights, logos, brand names, or other intellectual property mentioned or depicted on this site. Such intellectual property remains the property of its respective owners, and any references here are made solely for identification or informational purposes, without implying any affiliation, endorsement, or partnership.
We make no representations or warranties, express or implied, regarding the accuracy, completeness, or suitability of any content or products presented. Nothing on this website should be construed as legal, tax, investment, financial, medical, or other professional advice. In addition, no part of this site—including articles or product references—constitutes a solicitation, recommendation, endorsement, advertisement, or offer to buy or sell any securities, franchises, or other financial instruments, particularly in jurisdictions where such activity would be unlawful.
All content is of a general nature and may not address the specific circumstances of any individual or entity. It is not a substitute for professional advice or services. Any actions you take based on the information provided here are strictly at your own risk. You accept full responsibility for any decisions or outcomes arising from your use of this website and agree to release us from any liability in connection with your use of, or reliance upon, the content or products found herein.