
|
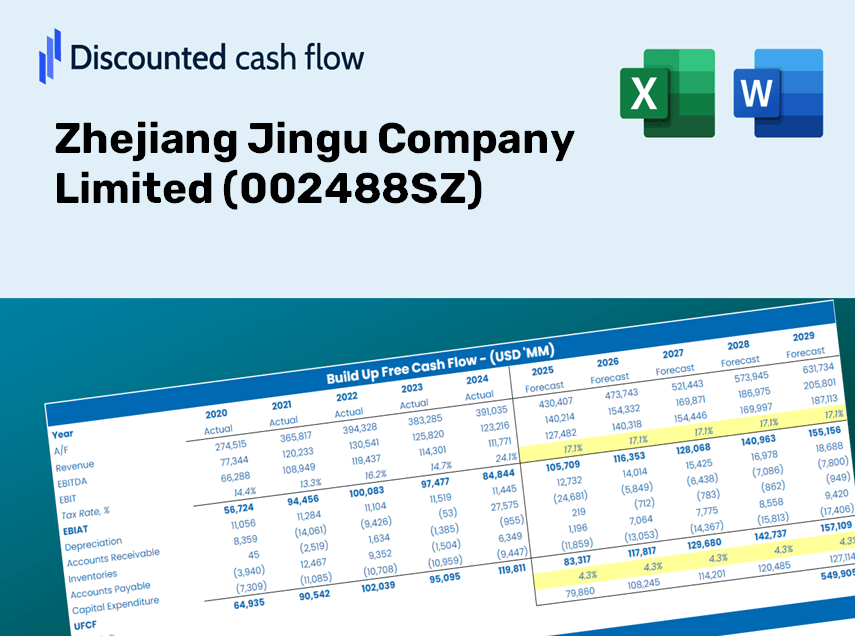
Zhejiang Jingu Company Limited (002488.sz) DCF -Bewertung |
Fully Editable: Tailor To Your Needs In Excel Or Sheets
Professional Design: Trusted, Industry-Standard Templates
Investor-Approved Valuation Models
MAC/PC Compatible, Fully Unlocked
No Expertise Is Needed; Easy To Follow
Zhejiang Jingu Company Limited (002488.SZ) Bundle
Verbessern Sie Ihre Anlagestrategien mit dem DCF -Taschenrechner (002488SZ)! Verwenden Sie authentische Finanzdaten von Zhejiang Jingu Company Limited, passen Sie Wachstumsprojektionen und -kosten an und beobachten Sie sofort, wie sich diese Modifikationen auf den inneren Wert von (002488SZ) auswirken.
What You Will Receive
- Authentic 002488SZ Financial Data: Pre-loaded with Zhejiang Jingu Company Limited’s historical and forecasted data for accurate analysis.
- Customizable Template: Easily adjust key inputs such as revenue growth, WACC, and EBITDA percentage.
- Instant Calculations: Observe real-time updates of Zhejiang Jingu’s intrinsic value as you modify inputs.
- Professional Valuation Tool: Tailored for investors, analysts, and consultants aiming for precise DCF results.
- User-Friendly Interface: Intuitive design and clear guidance suitable for users of all experience levels.
Key Features
- Comprehensive Data: Zhejiang Jingu Company Limited’s (002488SZ) historical financial reports and pre-filled projections.
- Customizable Inputs: Adjust WACC, tax rates, revenue growth, and EBITDA margins as needed.
- Real-Time Updates: Instantly view recalculated intrinsic values for Zhejiang Jingu Company Limited (002488SZ).
- Visual Performance Metrics: Dashboard charts illustrate valuation outcomes and essential indicators.
- Designed for Precision: A reliable tool for analysts, investors, and finance professionals.
How It Works
- Download: Obtain the pre-configured Excel file containing Zhejiang Jingu Company Limited's (002488SZ) financial data.
- Customize: Tailor your forecasts by adjusting revenue growth, EBITDA percentage, and WACC.
- Update Automatically: Watch as intrinsic value and NPV calculations refresh in real-time.
- Test Scenarios: Develop various projections and instantly compare their outcomes.
- Make Decisions: Utilize the valuation results to inform your investment strategy.
Why Select This Calculator for Zhejiang Jingu Company Limited (002488SZ)?
- Engineered for Experts: A sophisticated tool tailored for analysts, CFOs, and consultants.
- Accurate Data: Historical and projected financials for Zhejiang Jingu preloaded for precise calculations.
- Flexible Scenario Analysis: Effortlessly simulate various forecasts and assumptions.
- Comprehensive Outputs: Automatically determines intrinsic value, NPV, and essential metrics.
- User-Friendly: Clear, step-by-step guidance simplifies the entire process.
Who Can Benefit from This Product?
- Finance Students: Master valuation methods and apply them with actual data.
- Academics: Integrate professional models into your teaching or scholarly projects.
- Investors: Evaluate your assumptions and dissect valuation results for Zhejiang Jingu Company Limited (002488SZ).
- Analysts: Enhance your productivity with a customizable, pre-built DCF model.
- Small Business Owners: Understand the analysis of large public companies like Zhejiang Jingu Company Limited (002488SZ).
Contents of the Template
- Pre-Filled Data: Contains Zhejiang Jingu Company Limited's historical financial performance and projections.
- Discounted Cash Flow Model: An editable DCF valuation model featuring automatic calculation capabilities.
- Weighted Average Cost of Capital (WACC): A specific sheet designed for WACC calculation using personalized inputs.
- Key Financial Ratios: Evaluate the profitability, efficiency, and leverage of Zhejiang Jingu Company Limited.
- Customizable Inputs: Easily modify revenue growth, profit margins, and tax rates.
- Clear Dashboard: Visuals and tables that summarize the essential valuation outputs.
Disclaimer
All information, articles, and product details provided on this website are for general informational and educational purposes only. We do not claim any ownership over, nor do we intend to infringe upon, any trademarks, copyrights, logos, brand names, or other intellectual property mentioned or depicted on this site. Such intellectual property remains the property of its respective owners, and any references here are made solely for identification or informational purposes, without implying any affiliation, endorsement, or partnership.
We make no representations or warranties, express or implied, regarding the accuracy, completeness, or suitability of any content or products presented. Nothing on this website should be construed as legal, tax, investment, financial, medical, or other professional advice. In addition, no part of this site—including articles or product references—constitutes a solicitation, recommendation, endorsement, advertisement, or offer to buy or sell any securities, franchises, or other financial instruments, particularly in jurisdictions where such activity would be unlawful.
All content is of a general nature and may not address the specific circumstances of any individual or entity. It is not a substitute for professional advice or services. Any actions you take based on the information provided here are strictly at your own risk. You accept full responsibility for any decisions or outcomes arising from your use of this website and agree to release us from any liability in connection with your use of, or reliance upon, the content or products found herein.