
|
Shanghai Bairun Investment Holding Group Co., Ltd. (002568.sz) DCF -Bewertung |
Fully Editable: Tailor To Your Needs In Excel Or Sheets
Professional Design: Trusted, Industry-Standard Templates
Investor-Approved Valuation Models
MAC/PC Compatible, Fully Unlocked
No Expertise Is Needed; Easy To Follow
Shanghai Bairun Investment Holding Group Co., Ltd. (002568.SZ) Bundle
Egal, ob Sie ein Investor oder Analyst sind, dieser DCF -Taschenrechner (002568SZ) ist Ihr wesentliches Werkzeug für eine genaue Bewertung. Mit Shanghai Bairun Investment Holding Group Co., Ltd. Real Data können Sie Prognosen anpassen und die Auswirkungen in Echtzeit beobachten.
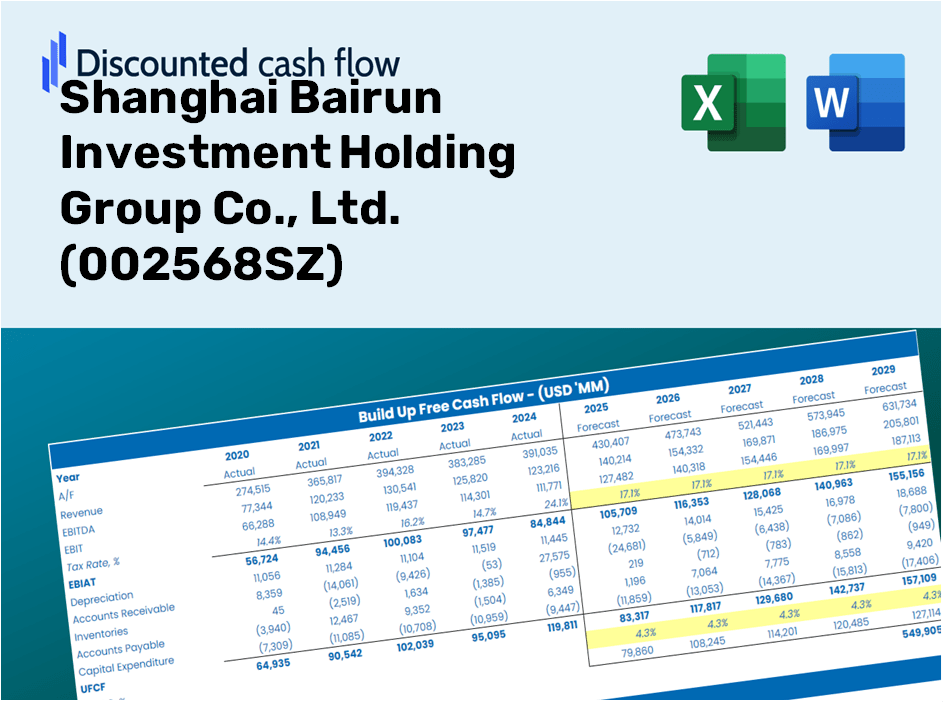
Discounted Cash Flow (DCF) - (USD MM)
| Year | AY1 2020 |
AY2 2021 |
AY3 2022 |
AY4 2023 |
AY5 2024 |
FY1 2025 |
FY2 2026 |
FY3 2027 |
FY4 2028 |
FY5 2029 |
|---|---|---|---|---|---|---|---|---|---|---|
| Revenue | 1,926.6 | 2,594.4 | 2,593.4 | 3,263.9 | 3,048.1 | 3,458.6 | 3,924.3 | 4,452.7 | 5,052.3 | 5,732.7 |
| Revenue Growth, % | 0 | 34.66 | -0.03660883 | 25.85 | -6.61 | 13.47 | 13.47 | 13.47 | 13.47 | 13.47 |
| EBITDA | 769.2 | 959.7 | 855.3 | 1,277.3 | 1,205.3 | 1,304.4 | 1,480.0 | 1,679.3 | 1,905.4 | 2,162.0 |
| EBITDA, % | 39.92 | 36.99 | 32.98 | 39.13 | 39.54 | 37.71 | 37.71 | 37.71 | 37.71 | 37.71 |
| Depreciation | 91.8 | 105.8 | 159.7 | 186.8 | 214.1 | 191.9 | 217.8 | 247.1 | 280.3 | 318.1 |
| Depreciation, % | 4.76 | 4.08 | 6.16 | 5.72 | 7.02 | 5.55 | 5.55 | 5.55 | 5.55 | 5.55 |
| EBIT | 677.4 | 853.9 | 695.6 | 1,090.5 | 991.3 | 1,112.4 | 1,262.2 | 1,432.2 | 1,625.1 | 1,843.9 |
| EBIT, % | 35.16 | 32.91 | 26.82 | 33.41 | 32.52 | 32.16 | 32.16 | 32.16 | 32.16 | 32.16 |
| Total Cash | 1,503.0 | 2,335.4 | 2,532.1 | 1,879.0 | 1,981.2 | 2,685.5 | 3,047.1 | 3,457.4 | 3,923.0 | 4,451.2 |
| Total Cash, percent | .0 | .0 | .0 | .0 | .0 | .0 | .0 | .0 | .0 | .0 |
| Account Receivables | 110.3 | 164.8 | 127.0 | 248.1 | 420.8 | 265.5 | 301.2 | 341.8 | 387.8 | 440.1 |
| Account Receivables, % | 5.72 | 6.35 | 4.9 | 7.6 | 13.8 | 7.68 | 7.68 | 7.68 | 7.68 | 7.68 |
| Inventories | 105.2 | 184.1 | 535.4 | 779.8 | 1,042.6 | 631.5 | 716.6 | 813.1 | 922.6 | 1,046.8 |
| Inventories, % | 5.46 | 7.1 | 20.64 | 23.89 | 34.21 | 18.26 | 18.26 | 18.26 | 18.26 | 18.26 |
| Accounts Payable | 371.9 | 541.5 | 487.5 | 499.0 | 546.5 | 637.7 | 723.6 | 821.0 | 931.5 | 1,057.0 |
| Accounts Payable, % | 19.3 | 20.87 | 18.8 | 15.29 | 17.93 | 18.44 | 18.44 | 18.44 | 18.44 | 18.44 |
| Capital Expenditure | -385.2 | -433.2 | -623.8 | -1,111.3 | -836.0 | -845.4 | -959.2 | -1,088.4 | -1,235.0 | -1,401.3 |
| Capital Expenditure, % | -19.99 | -16.7 | -24.05 | -34.05 | -27.43 | -24.44 | -24.44 | -24.44 | -24.44 | -24.44 |
| Tax Rate, % | 22.12 | 22.12 | 22.12 | 22.12 | 22.12 | 22.12 | 22.12 | 22.12 | 22.12 | 22.12 |
| EBITAT | 537.6 | 675.1 | 556.9 | 858.9 | 772.0 | 879.1 | 997.5 | 1,131.8 | 1,284.2 | 1,457.2 |
| Depreciation | ||||||||||
| Changes in Account Receivables | ||||||||||
| Changes in Inventories | ||||||||||
| Changes in Accounts Payable | ||||||||||
| Capital Expenditure | ||||||||||
| UFCF | 400.5 | 383.9 | -274.7 | -419.7 | -237.9 | 883.2 | 221.1 | 250.9 | 284.7 | 323.0 |
| WACC, % | 7.05 | 7.05 | 7.05 | 7.05 | 7.05 | 7.05 | 7.05 | 7.05 | 7.05 | 7.05 |
| PV UFCF | ||||||||||
| SUM PV UFCF | 1,669.0 | |||||||||
| Long Term Growth Rate, % | 4.00 | |||||||||
| Free cash flow (T + 1) | 336 | |||||||||
| Terminal Value | 11,014 | |||||||||
| Present Terminal Value | 7,834 | |||||||||
| Enterprise Value | 9,503 | |||||||||
| Net Debt | 372 | |||||||||
| Equity Value | 9,131 | |||||||||
| Diluted Shares Outstanding, MM | 1,042 | |||||||||
| Equity Value Per Share | 8.76 |
What You Will Receive
- Adjustable Forecast Inputs: Effortlessly modify assumptions (growth %, margins, WACC) to explore various scenarios.
- Real-World Data: Shanghai Bairun Investment Holding Group Co., Ltd.'s (002568SZ) financial data preloaded to accelerate your analysis.
- Automated DCF Outputs: The template computes Net Present Value (NPV) and intrinsic value automatically.
- Customizable and Professional: A refined Excel model tailored to meet your valuation requirements.
- Designed for Analysts and Investors: Perfect for testing projections, confirming strategies, and saving valuable time.
Key Features
- 🔍 Real-Life 002568SZ Financials: Pre-filled historical and projected data for Shanghai Bairun Investment Holding Group Co., Ltd.
- ✏️ Fully Customizable Inputs: Modify all essential parameters (yellow cells) such as WACC, growth %, and tax rates.
- 📊 Professional DCF Valuation: Integrated formulas compute the intrinsic value of Shanghai Bairun using the Discounted Cash Flow method.
- ⚡ Instant Results: See Shanghai Bairun’s valuation change immediately after adjusting parameters.
- Scenario Analysis: Evaluate and compare outcomes for different financial assumptions side-by-side.
How It Works
- Step 1: Download the prebuilt Excel template containing data for Shanghai Bairun Investment Holding Group Co., Ltd. (002568SZ).
- Step 2: Review the pre-filled sheets to familiarize yourself with the essential metrics.
- Step 3: Adjust forecasts and assumptions in the editable yellow cells (WACC, growth, margins).
- Step 4: Instantly access the recalculated results, including the intrinsic value of Shanghai Bairun Investment Holding Group Co., Ltd. (002568SZ).
- Step 5: Use the outputs to make informed investment choices or to create comprehensive reports.
Why Use the Bairun Investment Holding Calculator?
- Precision: Based on real financial data from Shanghai Bairun Investment Holding Group Co., Ltd. (002568SZ) for reliable results.
- Versatility: Crafted for users to experiment with and adjust inputs as they see fit.
- Efficiency: Eliminate the complexities of creating a DCF model from the ground up.
- High-Quality: Tailored with the accuracy and functionality expected at the CFO level.
- Intuitive: Designed for ease of use, making it accessible for individuals without extensive financial modeling skills.
Who Can Benefit from This Product?
- Investors: Assess the valuation of Shanghai Bairun Investment Holding Group Co., Ltd. (002568SZ) before making investment decisions.
- CFOs and Financial Analysts: Optimize valuation methodologies and evaluate financial projections.
- Entrepreneurs: Discover how established companies like Shanghai Bairun Investment Holding Group Co., Ltd. (002568SZ) are appraised.
- Consultants: Provide detailed valuation analyses and reports for your clientele.
- Students and Educators: Utilize current data to apply and teach valuation concepts effectively.
Contents of the Template
- Pre-Filled Data: Contains Shanghai Bairun Investment Holding Group Co., Ltd.'s historical financials and projections.
- Discounted Cash Flow Model: Editable DCF valuation model with automated calculations.
- Weighted Average Cost of Capital (WACC): A specific sheet for WACC calculation based on user-defined inputs.
- Key Financial Ratios: Evaluate Shanghai Bairun's profitability, efficiency, and financial leverage.
- Customizable Inputs: Easily modify revenue growth, profit margins, and tax rates.
- User-Friendly Dashboard: Visuals and tables summarizing essential valuation outcomes.
Disclaimer
All information, articles, and product details provided on this website are for general informational and educational purposes only. We do not claim any ownership over, nor do we intend to infringe upon, any trademarks, copyrights, logos, brand names, or other intellectual property mentioned or depicted on this site. Such intellectual property remains the property of its respective owners, and any references here are made solely for identification or informational purposes, without implying any affiliation, endorsement, or partnership.
We make no representations or warranties, express or implied, regarding the accuracy, completeness, or suitability of any content or products presented. Nothing on this website should be construed as legal, tax, investment, financial, medical, or other professional advice. In addition, no part of this site—including articles or product references—constitutes a solicitation, recommendation, endorsement, advertisement, or offer to buy or sell any securities, franchises, or other financial instruments, particularly in jurisdictions where such activity would be unlawful.
All content is of a general nature and may not address the specific circumstances of any individual or entity. It is not a substitute for professional advice or services. Any actions you take based on the information provided here are strictly at your own risk. You accept full responsibility for any decisions or outcomes arising from your use of this website and agree to release us from any liability in connection with your use of, or reliance upon, the content or products found herein.