
|
Shandong Sinobioway Biomedicine Co., Ltd. (002581.sz) DCF -Bewertung |
Fully Editable: Tailor To Your Needs In Excel Or Sheets
Professional Design: Trusted, Industry-Standard Templates
Investor-Approved Valuation Models
MAC/PC Compatible, Fully Unlocked
No Expertise Is Needed; Easy To Follow
Shandong Sinobioway Biomedicine Co., Ltd. (002581.SZ) Bundle
Entdecken Sie das finanzielle Potenzial von Shandong Sinobioway Biomedicine Co., Ltd. (002581SZ) mit unserem benutzerfreundlichen DCF-Taschenrechner! Geben Sie Ihr Wachstum, Margen und Kostenangebote ein, um den inneren Wert von Shandong Sinobioway Biomedicine Co., Ltd. (002581SZ) zu berechnen, und informieren Sie Ihre Anlageentscheidungen.
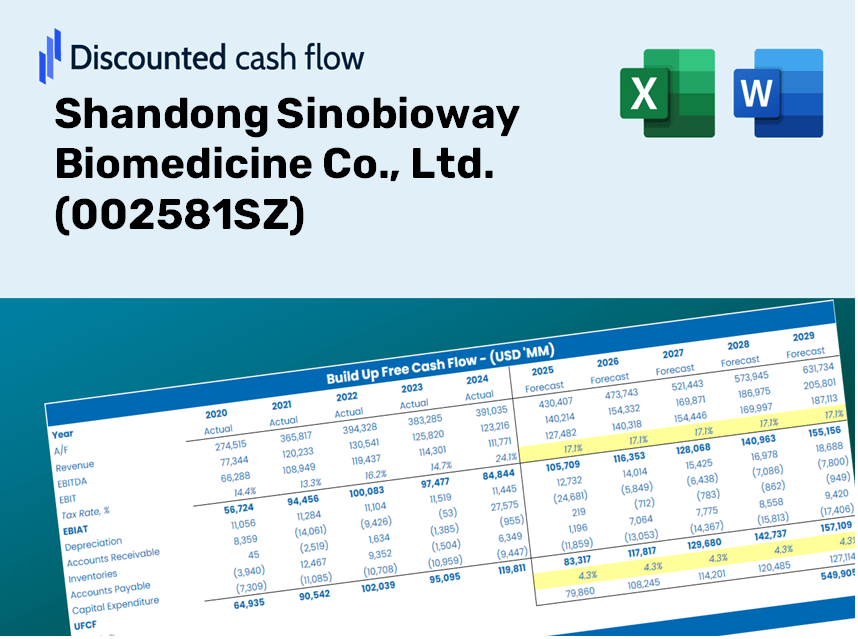
Discounted Cash Flow (DCF) - (USD MM)
| Year | AY1 2020 |
AY2 2021 |
AY3 2022 |
AY4 2023 |
AY5 2024 |
FY1 2025 |
FY2 2026 |
FY3 2027 |
FY4 2028 |
FY5 2029 |
|---|---|---|---|---|---|---|---|---|---|---|
| Revenue | 276.8 | 402.7 | 357.1 | 429.8 | 360.4 | 395.0 | 432.8 | 474.4 | 519.8 | 569.7 |
| Revenue Growth, % | 0 | 45.47 | -11.33 | 20.36 | -16.14 | 9.59 | 9.59 | 9.59 | 9.59 | 9.59 |
| EBITDA | -200.7 | -144.4 | -110.6 | -234.0 | -104.3 | -175.9 | -192.8 | -211.3 | -231.5 | -253.7 |
| EBITDA, % | -72.48 | -35.85 | -30.98 | -54.44 | -28.94 | -44.54 | -44.54 | -44.54 | -44.54 | -44.54 |
| Depreciation | 59.7 | 59.6 | 64.9 | 70.6 | 41.7 | 65.2 | 71.4 | 78.3 | 85.8 | 94.0 |
| Depreciation, % | 21.56 | 14.79 | 18.19 | 16.43 | 11.56 | 16.51 | 16.51 | 16.51 | 16.51 | 16.51 |
| EBIT | -260.3 | -203.9 | -175.6 | -304.6 | -146.0 | -241.1 | -264.2 | -289.6 | -317.3 | -347.8 |
| EBIT, % | -94.04 | -50.64 | -49.17 | -70.88 | -40.5 | -61.05 | -61.05 | -61.05 | -61.05 | -61.05 |
| Total Cash | 284.2 | 187.8 | 183.8 | 151.9 | 506.4 | 263.4 | 288.7 | 316.3 | 346.7 | 379.9 |
| Total Cash, percent | .0 | .0 | .0 | .0 | .0 | .0 | .0 | .0 | .0 | .0 |
| Account Receivables | 353.8 | 273.0 | 179.7 | 251.7 | 144.5 | 250.2 | 274.2 | 300.5 | 329.4 | 360.9 |
| Account Receivables, % | 127.79 | 67.78 | 50.33 | 58.57 | 40.1 | 63.36 | 63.36 | 63.36 | 63.36 | 63.36 |
| Inventories | 70.9 | 64.3 | 80.0 | 85.3 | 79.6 | 83.7 | 91.7 | 100.5 | 110.1 | 120.7 |
| Inventories, % | 25.6 | 15.98 | 22.42 | 19.85 | 22.1 | 21.19 | 21.19 | 21.19 | 21.19 | 21.19 |
| Accounts Payable | 14.5 | 42.1 | 43.6 | 73.7 | 35.3 | 43.3 | 47.5 | 52.0 | 57.0 | 62.5 |
| Accounts Payable, % | 5.22 | 10.46 | 12.22 | 17.15 | 9.81 | 10.97 | 10.97 | 10.97 | 10.97 | 10.97 |
| Capital Expenditure | -67.7 | -60.8 | -31.5 | -4.3 | -9.0 | -41.0 | -44.9 | -49.2 | -53.9 | -59.1 |
| Capital Expenditure, % | -24.45 | -15.11 | -8.81 | -1 | -2.5 | -10.38 | -10.38 | -10.38 | -10.38 | -10.38 |
| Tax Rate, % | 6.06 | 6.06 | 6.06 | 6.06 | 6.06 | 6.06 | 6.06 | 6.06 | 6.06 | 6.06 |
| EBITAT | -252.8 | -198.4 | 202.6 | -323.3 | -137.1 | -187.3 | -205.2 | -224.9 | -246.5 | -270.1 |
| Depreciation | ||||||||||
| Changes in Account Receivables | ||||||||||
| Changes in Inventories | ||||||||||
| Changes in Accounts Payable | ||||||||||
| Capital Expenditure | ||||||||||
| UFCF | -671.0 | -84.6 | 315.1 | -304.2 | -29.9 | -264.8 | -206.5 | -226.4 | -248.1 | -271.9 |
| WACC, % | 4.96 | 4.96 | 4.95 | 4.96 | 4.96 | 4.96 | 4.96 | 4.96 | 4.96 | 4.96 |
| PV UFCF | ||||||||||
| SUM PV UFCF | -1,053.4 | |||||||||
| Long Term Growth Rate, % | 2.00 | |||||||||
| Free cash flow (T + 1) | -277 | |||||||||
| Terminal Value | -9,376 | |||||||||
| Present Terminal Value | -7,361 | |||||||||
| Enterprise Value | -8,414 | |||||||||
| Net Debt | -504 | |||||||||
| Equity Value | -7,911 | |||||||||
| Diluted Shares Outstanding, MM | 229 | |||||||||
| Equity Value Per Share | -34.52 |
Benefits You Will Receive
- Authentic 002581SZ Financial Data: Offers both historical and projected figures for precise valuation.
- Customizable Parameters: Adjust inputs for WACC, tax rates, revenue growth, and capital expenditures.
- Real-Time Calculations: Intrinsic value and NPV calculated automatically as you input data.
- Scenario Planning: Explore various scenarios to assess the future trajectory of Shandong Sinobioway.
- User-Friendly Interface: Designed for professionals while remaining accessible for newcomers.
Key Features
- Comprehensive DCF Calculator: Features detailed unlevered and levered DCF valuation models tailored for Shandong Sinobioway Biomedicine Co., Ltd. (002581SZ).
- WACC Calculator: Pre-configured Weighted Average Cost of Capital sheet with adjustable inputs to suit your analysis needs.
- Customizable Forecast Assumptions: Easily adjust growth rates, capital expenditures, and discount rates for accurate projections.
- Integrated Financial Ratios: Assess profitability, leverage, and efficiency ratios specifically for Shandong Sinobioway Biomedicine Co., Ltd. (002581SZ).
- Interactive Dashboard and Charts: Visual representations of key valuation metrics for straightforward analysis and decision-making.
How It Works
- Step 1: Download the prebuilt Excel template featuring Shandong Sinobioway Biomedicine Co., Ltd. (002581SZ) data.
- Step 2: Review the pre-filled sheets to familiarize yourself with the essential metrics.
- Step 3: Adjust forecasts and assumptions in the editable yellow cells (WACC, growth rates, margins).
- Step 4: Instantly see the recalculated results, including the intrinsic value of Shandong Sinobioway Biomedicine Co., Ltd. (002581SZ).
- Step 5: Utilize the outputs to make informed investment decisions or to create detailed reports.
Why Opt for the Shandong Sinobioway Biomedicine Co., Ltd. Calculator?
- All-in-One Resource: Offers comprehensive DCF, WACC, and financial ratio assessments in one convenient tool.
- Adjustable Parameters: Modify yellow-highlighted inputs to explore different financial scenarios.
- In-Depth Analysis: Automatically computes the intrinsic value and Net Present Value for Shandong Sinobioway Biomedicine (002581SZ).
- Preloaded Information: Features both historical and projected data for precise starting figures.
- High-Quality Standards: Perfect for financial analysts, investors, and business consultants seeking reliable insights.
Who Can Benefit from This Product?
- Institutional Investors: Create comprehensive and accurate valuation models for analyzing portfolios involving Shandong Sinobioway Biomedicine Co., Ltd. (002581SZ).
- Corporate Finance Departments: Evaluate valuation scenarios to inform strategic decisions within their organizations.
- Consultants and Financial Advisors: Deliver precise valuation insights to clients interested in Shandong Sinobioway Biomedicine Co., Ltd. (002581SZ).
- Academic Professionals and Students: Utilize real market data for hands-on practice and instruction in financial modeling.
- Biotech Enthusiasts: Learn about the market valuation of biotech companies like Shandong Sinobioway Biomedicine Co., Ltd. (002581SZ).
Contents of the Template
- Detailed DCF Model: An editable template featuring intricate valuation calculations.
- Real-World Data: Shandong Sinobioway Biomedicine Co., Ltd.’s (002581SZ) historical and projected financials preloaded for thorough analysis.
- Adjustable Parameters: Modify WACC, growth rates, and tax assumptions to explore various scenarios.
- Comprehensive Financial Statements: Complete annual and quarterly breakdowns for enhanced insights.
- Essential Ratios: Integrated analysis for assessing profitability, efficiency, and leverage.
- Visual Dashboard: Charts and tables designed to present clear and actionable results.
Disclaimer
All information, articles, and product details provided on this website are for general informational and educational purposes only. We do not claim any ownership over, nor do we intend to infringe upon, any trademarks, copyrights, logos, brand names, or other intellectual property mentioned or depicted on this site. Such intellectual property remains the property of its respective owners, and any references here are made solely for identification or informational purposes, without implying any affiliation, endorsement, or partnership.
We make no representations or warranties, express or implied, regarding the accuracy, completeness, or suitability of any content or products presented. Nothing on this website should be construed as legal, tax, investment, financial, medical, or other professional advice. In addition, no part of this site—including articles or product references—constitutes a solicitation, recommendation, endorsement, advertisement, or offer to buy or sell any securities, franchises, or other financial instruments, particularly in jurisdictions where such activity would be unlawful.
All content is of a general nature and may not address the specific circumstances of any individual or entity. It is not a substitute for professional advice or services. Any actions you take based on the information provided here are strictly at your own risk. You accept full responsibility for any decisions or outcomes arising from your use of this website and agree to release us from any liability in connection with your use of, or reliance upon, the content or products found herein.