
|
Anhui Jinhe Industrial Co., Ltd. (002597.sz) DCF -Bewertung |
Fully Editable: Tailor To Your Needs In Excel Or Sheets
Professional Design: Trusted, Industry-Standard Templates
Investor-Approved Valuation Models
MAC/PC Compatible, Fully Unlocked
No Expertise Is Needed; Easy To Follow
Anhui Jinhe Industrial Co.,Ltd. (002597.SZ) Bundle
Entdecken Sie die finanziellen Aussichten von Anhui Jinhe Industrial Co., Ltd., mit unserem benutzerfreundlichen DCF-Taschenrechner! Geben Sie Ihre Annahmen für Wachstum, Margen und Kosten ein, um den inneren Wert von Anhui Jinhe Industrial Co., Ltd., zu bestimmen, und informieren Sie Ihren Investitionsansatz.
Discounted Cash Flow (DCF) - (USD MM)
| Year | AY1 2020 |
AY2 2021 |
AY3 2022 |
AY4 2023 |
AY5 2024 |
FY1 2025 |
FY2 2026 |
FY3 2027 |
FY4 2028 |
FY5 2029 |
|---|---|---|---|---|---|---|---|---|---|---|
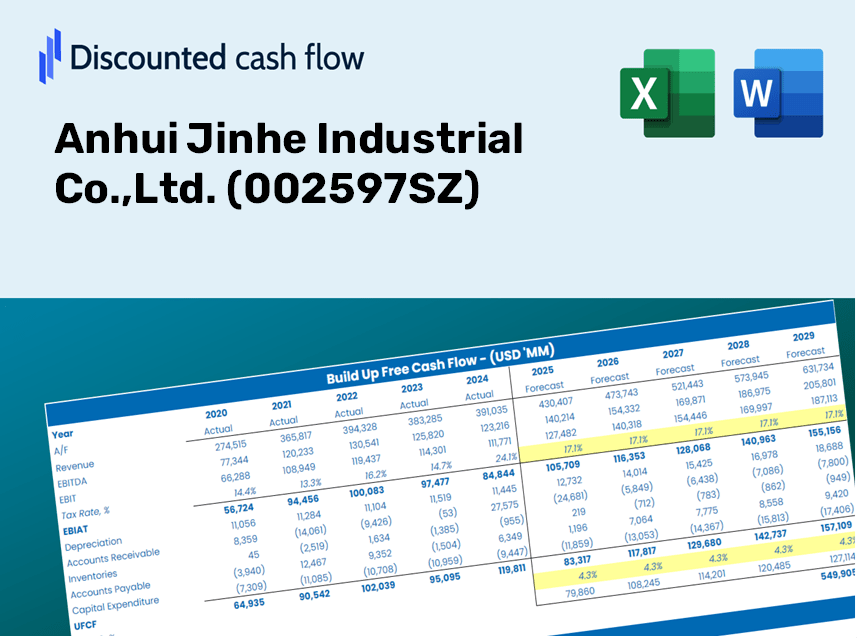
| Revenue | 3,666.2 | 5,845.3 | 7,250.5 | 5,311.1 | 5,303.2 | 6,053.3 | 6,909.5 | 7,886.8 | 9,002.3 | 10,275.6 |
| Revenue Growth, % | 0 | 59.44 | 24.04 | -26.75 | -0.14968 | 14.14 | 14.14 | 14.14 | 14.14 | 14.14 |
| EBITDA | 924.4 | 1,499.3 | 2,295.2 | 1,020.5 | 920.6 | 1,441.8 | 1,645.7 | 1,878.5 | 2,144.2 | 2,447.5 |
| EBITDA, % | 25.21 | 25.65 | 31.66 | 19.21 | 17.36 | 23.82 | 23.82 | 23.82 | 23.82 | 23.82 |
| Depreciation | 262.3 | 308.5 | 334.1 | 342.8 | 396.4 | 374.9 | 428.0 | 488.5 | 557.6 | 636.5 |
| Depreciation, % | 7.15 | 5.28 | 4.61 | 6.45 | 7.47 | 6.19 | 6.19 | 6.19 | 6.19 | 6.19 |
| EBIT | 662.1 | 1,190.8 | 1,961.1 | 677.6 | 524.2 | 1,066.9 | 1,217.8 | 1,390.0 | 1,586.6 | 1,811.0 |
| EBIT, % | 18.06 | 20.37 | 27.05 | 12.76 | 9.89 | 17.62 | 17.62 | 17.62 | 17.62 | 17.62 |
| Total Cash | 2,019.3 | 3,254.0 | 4,073.0 | 3,055.9 | 2,766.6 | 3,349.0 | 3,822.7 | 4,363.4 | 4,980.6 | 5,685.1 |
| Total Cash, percent | .0 | .0 | .0 | .0 | .0 | .0 | .0 | .0 | .0 | .0 |
| Account Receivables | 767.6 | 1,361.3 | 1,424.9 | 1,051.8 | 893.3 | 1,217.1 | 1,389.2 | 1,585.7 | 1,810.0 | 2,066.0 |
| Account Receivables, % | 20.94 | 23.29 | 19.65 | 19.8 | 16.85 | 20.11 | 20.11 | 20.11 | 20.11 | 20.11 |
| Inventories | 340.3 | 505.7 | 627.4 | 783.6 | 608.7 | 639.5 | 729.9 | 833.1 | 951.0 | 1,085.5 |
| Inventories, % | 9.28 | 8.65 | 8.65 | 14.75 | 11.48 | 10.56 | 10.56 | 10.56 | 10.56 | 10.56 |
| Accounts Payable | 942.2 | 1,089.6 | 927.9 | 1,091.3 | 585.1 | 1,074.1 | 1,226.0 | 1,399.4 | 1,597.3 | 1,823.3 |
| Accounts Payable, % | 25.7 | 18.64 | 12.8 | 20.55 | 11.03 | 17.74 | 17.74 | 17.74 | 17.74 | 17.74 |
| Capital Expenditure | -860.5 | -703.1 | -713.7 | -961.3 | -1,133.5 | -1,026.8 | -1,172.0 | -1,337.8 | -1,527.1 | -1,743.0 |
| Capital Expenditure, % | -23.47 | -12.03 | -9.84 | -18.1 | -21.37 | -16.96 | -16.96 | -16.96 | -16.96 | -16.96 |
| Tax Rate, % | 13.13 | 13.13 | 13.13 | 13.13 | 13.13 | 13.13 | 13.13 | 13.13 | 13.13 | 13.13 |
| EBITAT | 572.8 | 1,027.8 | 1,729.1 | 600.2 | 455.4 | 931.3 | 1,063.0 | 1,213.3 | 1,384.9 | 1,580.8 |
| Depreciation | ||||||||||
| Changes in Account Receivables | ||||||||||
| Changes in Inventories | ||||||||||
| Changes in Accounts Payable | ||||||||||
| Capital Expenditure | ||||||||||
| UFCF | -191.1 | 21.4 | 1,002.6 | 362.1 | -454.4 | 413.8 | 208.2 | 237.7 | 271.3 | 309.7 |
| WACC, % | 6.24 | 6.24 | 6.24 | 6.24 | 6.24 | 6.24 | 6.24 | 6.24 | 6.24 | 6.24 |
| PV UFCF | ||||||||||
| SUM PV UFCF | 1,213.9 | |||||||||
| Long Term Growth Rate, % | 1.00 | |||||||||
| Free cash flow (T + 1) | 313 | |||||||||
| Terminal Value | 5,968 | |||||||||
| Present Terminal Value | 4,409 | |||||||||
| Enterprise Value | 5,623 | |||||||||
| Net Debt | -964 | |||||||||
| Equity Value | 6,587 | |||||||||
| Diluted Shares Outstanding, MM | 551 | |||||||||
| Equity Value Per Share | 11.95 |
What You Will Gain
- Authentic AJII Financials: Access to historical and projected data for precise valuation.
- Customizable Parameters: Adjust WACC, tax rates, revenue growth, and capital expenditures as needed.
- Dynamic Calculations: Intrinsic value and NPV are computed in real-time.
- Scenario Testing: Evaluate various scenarios to assess the future performance of Anhui Jinhe Industrial Co.,Ltd. (002597SZ).
- User-Friendly Interface: Designed for professionals while being easy to navigate for newcomers.
Key Features
- Genuine Anhui Jinhe Financials: Gain access to accurate, pre-loaded historical data and future projections for [002597].
- Adjustable Forecast Assumptions: Modify the highlighted cells, including WACC, growth rates, and margin assumptions.
- Real-Time Calculations: Automatic updates for DCF, Net Present Value (NPV), and cash flow evaluations.
- Interactive Dashboard: Intuitive charts and summaries designed to help you visualize your valuation outcomes.
- Suitable for All Skill Levels: A user-friendly layout designed for investors, CFOs, and consultants alike.
How It Functions
- 1. Access the Template: Download and open the Excel file containing Anhui Jinhe Industrial Co., Ltd.'s preloaded data.
- 2. Adjust Key Inputs: Modify essential variables such as growth projections, WACC, and capital expenditures.
- 3. View Results in Real-Time: The DCF model automatically calculates the intrinsic value and NPV.
- 4. Explore Various Scenarios: Analyze different valuation outcomes by comparing multiple forecasts.
- 5. Present with Assurance: Share professional valuation insights to reinforce your decision-making processes.
Why Opt for Our Financial Calculator?
- All-in-One Solution: Combines DCF, WACC, and key financial ratio evaluations into a single tool.
- Flexible Inputs: Modify the highlighted cells to explore different financial scenarios.
- In-Depth Analysis: Automatically computes the intrinsic value and Net Present Value for Anhui Jinhe Industrial Co.,Ltd. (002597SZ).
- Ready-to-Use Data: Contains both historical and forecasted data for reliable analysis.
- Expert-Level Precision: Perfect for financial analysts, investors, and business advisors.
Who Should Use This Product?
- Finance Students: Master valuation strategies and utilize real-world data in your analyses.
- Academics: Integrate industry-standard models into your teaching or research initiatives.
- Investors: Validate your hypotheses and scrutinize valuation results for Anhui Jinhe Industrial Co., Ltd. (002597SZ).
- Analysts: Enhance your efficiency with a customizable, ready-to-use DCF model.
- Small Business Owners: Discover how major publicly traded companies like Anhui Jinhe Industrial Co., Ltd. (002597SZ) are evaluated in the marketplace.
Contents of the Template
- Comprehensive DCF Model: An editable template featuring extensive valuation calculations.
- Real-World Data: Anhui Jinhe Industrial Co., Ltd.'s historical and projected financials preloaded for your analysis.
- Customizable Parameters: Modify WACC, growth rates, and tax assumptions to explore various scenarios.
- Financial Statements: Complete annual and quarterly reports for in-depth insights.
- Key Ratios: Integrated analysis for profitability, efficiency, and leverage metrics.
- Dashboard with Visual Outputs: Visualizations such as charts and tables to present clear and actionable results.
Disclaimer
All information, articles, and product details provided on this website are for general informational and educational purposes only. We do not claim any ownership over, nor do we intend to infringe upon, any trademarks, copyrights, logos, brand names, or other intellectual property mentioned or depicted on this site. Such intellectual property remains the property of its respective owners, and any references here are made solely for identification or informational purposes, without implying any affiliation, endorsement, or partnership.
We make no representations or warranties, express or implied, regarding the accuracy, completeness, or suitability of any content or products presented. Nothing on this website should be construed as legal, tax, investment, financial, medical, or other professional advice. In addition, no part of this site—including articles or product references—constitutes a solicitation, recommendation, endorsement, advertisement, or offer to buy or sell any securities, franchises, or other financial instruments, particularly in jurisdictions where such activity would be unlawful.
All content is of a general nature and may not address the specific circumstances of any individual or entity. It is not a substitute for professional advice or services. Any actions you take based on the information provided here are strictly at your own risk. You accept full responsibility for any decisions or outcomes arising from your use of this website and agree to release us from any liability in connection with your use of, or reliance upon, the content or products found herein.