
|
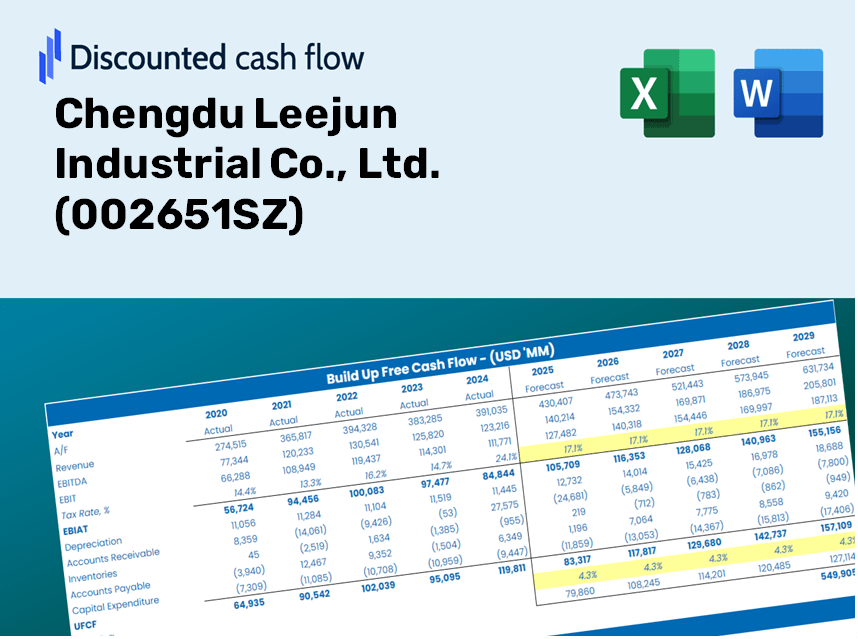
Chengdu Leejun Industrial Co., Ltd. (002651.sz) DCF -Bewertung |
Fully Editable: Tailor To Your Needs In Excel Or Sheets
Professional Design: Trusted, Industry-Standard Templates
Investor-Approved Valuation Models
MAC/PC Compatible, Fully Unlocked
No Expertise Is Needed; Easy To Follow
Chengdu Leejun Industrial Co., Ltd. (002651.SZ) Bundle
Verbessern Sie Ihre Anlagestrategien mit dem DCF -Taschenrechner (002651SZ)! Erforschen Sie authentische Finanzdaten von Chengdu Leejun Industrial Co., Ltd., stellen Sie Wachstumsvorhersagen und -kosten an und beobachten Sie sofort, wie sich diese Modifikationen auf den inneren Wert von (002651SZ) auswirken.
Discounted Cash Flow (DCF) - (USD MM)
| Year | AY1 2020 |
AY2 2021 |
AY3 2022 |
AY4 2023 |
AY5 2024 |
FY1 2025 |
FY2 2026 |
FY3 2027 |
FY4 2028 |
FY5 2029 |
|---|---|---|---|---|---|---|---|---|---|---|
| Revenue | 818.9 | 958.9 | 1,019.9 | 1,072.7 | 776.2 | 778.2 | 780.1 | 782.0 | 784.0 | 785.9 |
| Revenue Growth, % | 0 | 17.1 | 6.36 | 5.17 | -27.63 | 0.24827 | 0.24827 | 0.24827 | 0.24827 | 0.24827 |
| EBITDA | 215.4 | 234.5 | 267.1 | 264.0 | 143.0 | 186.7 | 187.2 | 187.7 | 188.1 | 188.6 |
| EBITDA, % | 26.31 | 24.46 | 26.18 | 24.61 | 18.42 | 24 | 24 | 24 | 24 | 24 |
| Depreciation | 27.9 | 30.8 | 47.1 | 53.7 | 52.4 | 35.8 | 35.9 | 36.0 | 36.1 | 36.1 |
| Depreciation, % | 3.41 | 3.21 | 4.62 | 5.01 | 6.74 | 4.6 | 4.6 | 4.6 | 4.6 | 4.6 |
| EBIT | 187.5 | 203.7 | 220.0 | 210.2 | 90.6 | 150.9 | 151.3 | 151.7 | 152.1 | 152.4 |
| EBIT, % | 22.89 | 21.24 | 21.57 | 19.6 | 11.68 | 19.4 | 19.4 | 19.4 | 19.4 | 19.4 |
| Total Cash | 1,047.2 | 1,167.3 | 1,313.9 | 1,261.5 | 1,549.6 | 778.2 | 780.1 | 782.0 | 784.0 | 785.9 |
| Total Cash, percent | .0 | .0 | .0 | .0 | .0 | .0 | .0 | .0 | .0 | .0 |
| Account Receivables | 479.3 | 447.8 | 488.5 | 497.7 | 336.8 | 378.1 | 379.0 | 379.9 | 380.9 | 381.8 |
| Account Receivables, % | 58.53 | 46.7 | 47.9 | 46.4 | 43.39 | 48.58 | 48.58 | 48.58 | 48.58 | 48.58 |
| Inventories | 399.1 | 491.7 | 518.1 | 379.6 | 364.6 | 362.9 | 363.8 | 364.7 | 365.6 | 366.5 |
| Inventories, % | 48.74 | 51.28 | 50.8 | 35.39 | 46.97 | 46.64 | 46.64 | 46.64 | 46.64 | 46.64 |
| Accounts Payable | 212.9 | 265.9 | 330.8 | 276.8 | 137.5 | 201.8 | 202.3 | 202.8 | 203.3 | 203.8 |
| Accounts Payable, % | 25.99 | 27.72 | 32.44 | 25.81 | 17.71 | 25.93 | 25.93 | 25.93 | 25.93 | 25.93 |
| Capital Expenditure | -180.6 | -194.9 | -57.6 | -35.3 | -63.1 | -92.5 | -92.7 | -93.0 | -93.2 | -93.4 |
| Capital Expenditure, % | -22.05 | -20.33 | -5.65 | -3.29 | -8.13 | -11.89 | -11.89 | -11.89 | -11.89 | -11.89 |
| Tax Rate, % | 12.79 | 12.79 | 12.79 | 12.79 | 12.79 | 12.79 | 12.79 | 12.79 | 12.79 | 12.79 |
| EBITAT | 160.5 | 173.5 | 189.4 | 158.9 | 79.1 | 126.7 | 127.0 | 127.3 | 127.6 | 128.0 |
| Depreciation | ||||||||||
| Changes in Account Receivables | ||||||||||
| Changes in Inventories | ||||||||||
| Changes in Accounts Payable | ||||||||||
| Capital Expenditure | ||||||||||
| UFCF | -657.8 | 1.4 | 176.7 | 252.6 | 104.9 | 94.7 | 68.8 | 69.0 | 69.1 | 69.3 |
| WACC, % | 7.32 | 7.32 | 7.32 | 7.32 | 7.32 | 7.32 | 7.32 | 7.32 | 7.32 | 7.32 |
| PV UFCF | ||||||||||
| SUM PV UFCF | 304.6 | |||||||||
| Long Term Growth Rate, % | 3.50 | |||||||||
| Free cash flow (T + 1) | 72 | |||||||||
| Terminal Value | 1,879 | |||||||||
| Present Terminal Value | 1,320 | |||||||||
| Enterprise Value | 1,625 | |||||||||
| Net Debt | -1,539 | |||||||||
| Equity Value | 3,164 | |||||||||
| Diluted Shares Outstanding, MM | 1,001 | |||||||||
| Equity Value Per Share | 3.16 |
Benefits You Will Receive
- Authentic Chengdu Leejun Data: Preloaded financials – covering everything from revenue to EBIT – based on actual and forecasted figures.
- Comprehensive Customization: Modify all key parameters (yellow cells) such as WACC, growth %, and tax rates.
- Immediate Valuation Adjustments: Automatic recalculations to assess the effects of changes on Chengdu Leejun’s fair value.
- Flexible Excel Template: Designed for easy edits, scenario analysis, and in-depth projections.
- Efficient and Precise: Eliminate the need to build models from the ground up while ensuring accuracy and adaptability.
Key Features
- Customizable Financial Inputs: Adjust essential parameters such as revenue growth, EBITDA margin, and capital expenditures.
- Instant DCF Valuation: Automatically computes intrinsic value, NPV, and additional financial metrics in real-time.
- High-Precision Accuracy: Leverages Chengdu Leejun Industrial Co., Ltd.'s (002651SZ) actual financial data for reliable valuation results.
- Simplified Scenario Analysis: Effortlessly experiment with various assumptions and evaluate different outcomes.
- Efficiency Booster: Streamlines the valuation process, removing the need to create intricate models from the ground up.
How It Works
- Step 1: Download the Excel file.
- Step 2: Review Chengdu Leejun Industrial Co., Ltd.'s pre-filled financial data and forecasts.
- Step 3: Adjust key inputs such as revenue growth, WACC, and tax rates (highlighted cells).
- Step 4: Observe the DCF model refresh in real-time as you update your assumptions.
- Step 5: Evaluate the results and leverage them for your investment decisions.
Why Opt for Chengdu Leejun Industrial Co., Ltd. (002651SZ) Solutions?
- Time Efficient: Skip the hassle of building complex models – our solutions are ready to implement.
- Enhanced Accuracy: Dependable financial data and methodologies minimize valuation errors.
- Completely Customizable: Adjust the model to suit your specific assumptions and forecasts.
- User-Friendly: Intuitive charts and outputs facilitate straightforward analysis of results.
- Endorsed by Professionals: Crafted for experts who prioritize accuracy and functionality.
Who Should Consider This Product?
- Institutional Investors: Develop comprehensive and dependable valuation models for portfolio assessments related to Chengdu Leejun Industrial Co., Ltd. (002651SZ).
- Corporate Finance Departments: Evaluate valuation scenarios to inform strategic decision-making within their organizations.
- Consultants and Financial Advisors: Equip clients with precise valuation insights for Chengdu Leejun Industrial Co., Ltd. (002651SZ) stock.
- Students and Instructors: Leverage real-time data to enhance practical skills in financial modeling and education.
- Industry Analysts: Gain insights into the valuation methodologies used for companies like Chengdu Leejun Industrial Co., Ltd. (002651SZ).
Contents of the Template
- Pre-Filled Data: Contains Chengdu Leejun Industrial Co., Ltd.'s historical financial information and projections.
- Discounted Cash Flow Model: An editable DCF valuation model featuring automatic calculations.
- Weighted Average Cost of Capital (WACC): A designated sheet for WACC calculations based on user-defined inputs.
- Key Financial Ratios: Assess Chengdu Leejun's profitability, operational efficiency, and financial leverage.
- Customizable Inputs: Easily modify revenue growth rates, profit margins, and tax rates.
- Clear Dashboard: Visual representations and tables that summarize essential valuation outcomes.
Disclaimer
All information, articles, and product details provided on this website are for general informational and educational purposes only. We do not claim any ownership over, nor do we intend to infringe upon, any trademarks, copyrights, logos, brand names, or other intellectual property mentioned or depicted on this site. Such intellectual property remains the property of its respective owners, and any references here are made solely for identification or informational purposes, without implying any affiliation, endorsement, or partnership.
We make no representations or warranties, express or implied, regarding the accuracy, completeness, or suitability of any content or products presented. Nothing on this website should be construed as legal, tax, investment, financial, medical, or other professional advice. In addition, no part of this site—including articles or product references—constitutes a solicitation, recommendation, endorsement, advertisement, or offer to buy or sell any securities, franchises, or other financial instruments, particularly in jurisdictions where such activity would be unlawful.
All content is of a general nature and may not address the specific circumstances of any individual or entity. It is not a substitute for professional advice or services. Any actions you take based on the information provided here are strictly at your own risk. You accept full responsibility for any decisions or outcomes arising from your use of this website and agree to release us from any liability in connection with your use of, or reliance upon, the content or products found herein.