
|
Peking SDL Technology Co., Ltd. (002658.sz) DCF -Bewertung |
Fully Editable: Tailor To Your Needs In Excel Or Sheets
Professional Design: Trusted, Industry-Standard Templates
Investor-Approved Valuation Models
MAC/PC Compatible, Fully Unlocked
No Expertise Is Needed; Easy To Follow
Beijing SDL Technology Co.,Ltd. (002658.SZ) Bundle
Unser (002658SZ) DCF-Taschenrechner konzipiert für die Genauigkeit und ermöglicht es Ihnen, die Bewertung von Peking SDL Technology Co., Ltd., unter Verwendung realer Finanzdaten zu bewerten, und bietet vollständige Flexibilität, um alle wesentlichen Parameter für verbesserte Projektionen zu ändern.
Discounted Cash Flow (DCF) - (USD MM)
| Year | AY1 2020 |
AY2 2021 |
AY3 2022 |
AY4 2023 |
AY5 2024 |
FY1 2025 |
FY2 2026 |
FY3 2027 |
FY4 2028 |
FY5 2029 |
|---|---|---|---|---|---|---|---|---|---|---|
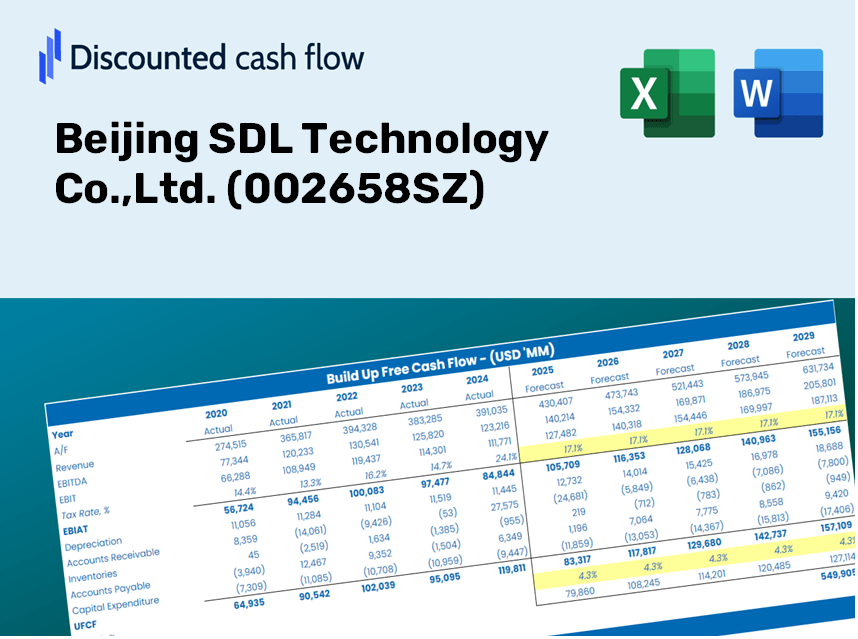
| Revenue | 1,212.8 | 1,380.9 | 1,504.8 | 1,510.3 | 1,420.2 | 1,481.3 | 1,545.2 | 1,611.7 | 1,681.2 | 1,753.6 |
| Revenue Growth, % | 0 | 13.86 | 8.97 | 0.36888 | -5.97 | 4.31 | 4.31 | 4.31 | 4.31 | 4.31 |
| EBITDA | 236.8 | 304.2 | 383.3 | 270.5 | 237.6 | 301.2 | 314.2 | 327.7 | 341.8 | 356.5 |
| EBITDA, % | 19.53 | 22.03 | 25.47 | 17.91 | 16.73 | 20.33 | 20.33 | 20.33 | 20.33 | 20.33 |
| Depreciation | 32.4 | 32.0 | 38.3 | 41.1 | 38.1 | 38.3 | 40.0 | 41.7 | 43.5 | 45.4 |
| Depreciation, % | 2.67 | 2.32 | 2.54 | 2.72 | 2.68 | 2.59 | 2.59 | 2.59 | 2.59 | 2.59 |
| EBIT | 204.4 | 272.2 | 345.0 | 229.4 | 199.5 | 262.9 | 274.2 | 286.0 | 298.3 | 311.2 |
| EBIT, % | 16.86 | 19.71 | 22.93 | 15.19 | 14.05 | 17.75 | 17.75 | 17.75 | 17.75 | 17.75 |
| Total Cash | 1,555.0 | 1,641.8 | 1,648.2 | 1,472.6 | 1,449.8 | 1,474.0 | 1,537.4 | 1,603.7 | 1,672.8 | 1,744.8 |
| Total Cash, percent | .0 | .0 | .0 | .0 | .0 | .0 | .0 | .0 | .0 | .0 |
| Account Receivables | 613.0 | 658.2 | 718.0 | 719.7 | 717.8 | 723.2 | 754.4 | 786.9 | 820.8 | 856.2 |
| Account Receivables, % | 50.54 | 47.66 | 47.71 | 47.65 | 50.54 | 48.82 | 48.82 | 48.82 | 48.82 | 48.82 |
| Inventories | 559.5 | 581.7 | 553.3 | 458.4 | 414.0 | 546.7 | 570.3 | 594.8 | 620.5 | 647.2 |
| Inventories, % | 46.14 | 42.13 | 36.77 | 30.35 | 29.15 | 36.91 | 36.91 | 36.91 | 36.91 | 36.91 |
| Accounts Payable | 130.9 | 151.8 | 120.9 | 148.0 | 152.5 | 149.2 | 155.6 | 162.3 | 169.3 | 176.6 |
| Accounts Payable, % | 10.79 | 10.99 | 8.03 | 9.8 | 10.74 | 10.07 | 10.07 | 10.07 | 10.07 | 10.07 |
| Capital Expenditure | -36.1 | -76.5 | -35.9 | -29.1 | -29.8 | -44.2 | -46.1 | -48.1 | -50.2 | -52.3 |
| Capital Expenditure, % | -2.98 | -5.54 | -2.39 | -1.93 | -2.1 | -2.99 | -2.99 | -2.99 | -2.99 | -2.99 |
| Tax Rate, % | 15.26 | 15.26 | 15.26 | 15.26 | 15.26 | 15.26 | 15.26 | 15.26 | 15.26 | 15.26 |
| EBITAT | 174.2 | 237.2 | 301.3 | 206.3 | 169.1 | 228.4 | 238.2 | 248.5 | 259.2 | 270.4 |
| Depreciation | ||||||||||
| Changes in Account Receivables | ||||||||||
| Changes in Inventories | ||||||||||
| Changes in Accounts Payable | ||||||||||
| Capital Expenditure | ||||||||||
| UFCF | -871.2 | 146.2 | 241.5 | 338.4 | 228.2 | 81.0 | 183.8 | 191.7 | 199.9 | 208.6 |
| WACC, % | 4.7 | 4.71 | 4.71 | 4.71 | 4.7 | 4.71 | 4.71 | 4.71 | 4.71 | 4.71 |
| PV UFCF | ||||||||||
| SUM PV UFCF | 744.1 | |||||||||
| Long Term Growth Rate, % | 3.50 | |||||||||
| Free cash flow (T + 1) | 216 | |||||||||
| Terminal Value | 17,908 | |||||||||
| Present Terminal Value | 14,230 | |||||||||
| Enterprise Value | 14,974 | |||||||||
| Net Debt | -564 | |||||||||
| Equity Value | 15,537 | |||||||||
| Diluted Shares Outstanding, MM | 624 | |||||||||
| Equity Value Per Share | 24.89 |
What You Will Receive
- Authentic Beijing SDL Data: Preloaded financials – encompassing revenue through EBIT – derived from actual and projected data.
- Comprehensive Customization: Modify all key parameters (yellow cells) such as WACC, growth %, and tax rates to suit your analysis.
- Immediate Valuation Adjustments: Automatic recalculations to assess the effect of changes on Beijing SDL's fair value.
- Flexible Excel Template: Designed for swift modifications, scenario analysis, and detailed forecasting.
- Effort-Saving and Precise: Eliminate the need to construct models from the ground up while ensuring accuracy and adaptability.
Key Features
- Accurate Financial Data for Beijing SDL Technology: Get reliable pre-loaded historical figures and future forecasts.
- Adjustable Forecast Parameters: Modify highlighted cells for key metrics like WACC, growth rates, and profit margins.
- Real-Time Calculations: Automatic recalculations for DCF, Net Present Value (NPV), and cash flow assessments.
- User-Friendly Dashboard: Clear and concise charts and summaries to help you interpret your valuation findings.
- Designed for All Levels: An intuitive layout suitable for investors, CFOs, and consultants alike.
How It Works
- Step 1: Download the ready-to-use Excel template featuring Beijing SDL Technology Co., Ltd.'s data.
- Step 2: Navigate through the pre-filled sheets to familiarize yourself with the essential metrics.
- Step 3: Adjust forecasts and assumptions in the editable yellow cells (WACC, growth, margins).
- Step 4: Instantly see the updated results, including the intrinsic value of Beijing SDL Technology Co., Ltd. (002658SZ).
- Step 5: Make well-informed investment choices or create reports based on the generated outputs.
Why Choose This Calculator for Beijing SDL Technology Co., Ltd. (002658SZ)?
- All-in-One Tool: Combines DCF, WACC, and financial ratio evaluations for thorough analysis.
- Flexible Inputs: Modify the highlighted cells to explore different scenarios.
- In-Depth Analysis: Automatically computes the intrinsic value and Net Present Value for Beijing SDL Technology Co., Ltd.
- Preloaded Information: Comes with historical and projected data for reliable starting points.
- High-Quality Results: Perfect for financial analysts, investors, and business consultants.
Who Can Benefit from This Product?
- Investors: Accurately determine the fair value of Beijing SDL Technology Co., Ltd. before making investment choices.
- CFOs: Utilize a professional-grade DCF model for comprehensive financial reporting and analysis.
- Consultants: Efficiently customize the template for valuation reports tailored to your clients.
- Entrepreneurs: Acquire insights into the financial modeling practices of leading companies.
- Educators: Employ it as a teaching resource to illustrate various valuation methodologies.
Overview of the Template Components
- Pre-Filled DCF Model: Beijing SDL Technology Co., Ltd.'s (002658SZ) financial data preloaded for immediate application.
- WACC Calculator: Comprehensive calculations for the Weighted Average Cost of Capital.
- Financial Ratios: Assess Beijing SDL Technology Co., Ltd.'s profitability, leverage, and operational efficiency.
- Editable Inputs: Modify assumptions such as growth rates, margins, and capital expenditures to align with your scenarios.
- Financial Statements: Annual and quarterly reports to facilitate in-depth analysis.
- Interactive Dashboard: Effortlessly visualize essential valuation metrics and outcomes.
Disclaimer
All information, articles, and product details provided on this website are for general informational and educational purposes only. We do not claim any ownership over, nor do we intend to infringe upon, any trademarks, copyrights, logos, brand names, or other intellectual property mentioned or depicted on this site. Such intellectual property remains the property of its respective owners, and any references here are made solely for identification or informational purposes, without implying any affiliation, endorsement, or partnership.
We make no representations or warranties, express or implied, regarding the accuracy, completeness, or suitability of any content or products presented. Nothing on this website should be construed as legal, tax, investment, financial, medical, or other professional advice. In addition, no part of this site—including articles or product references—constitutes a solicitation, recommendation, endorsement, advertisement, or offer to buy or sell any securities, franchises, or other financial instruments, particularly in jurisdictions where such activity would be unlawful.
All content is of a general nature and may not address the specific circumstances of any individual or entity. It is not a substitute for professional advice or services. Any actions you take based on the information provided here are strictly at your own risk. You accept full responsibility for any decisions or outcomes arising from your use of this website and agree to release us from any liability in connection with your use of, or reliance upon, the content or products found herein.