
|
Shenzhen Click Technology Co., Ltd. (002782.sz) DCF -Bewertung |
Fully Editable: Tailor To Your Needs In Excel Or Sheets
Professional Design: Trusted, Industry-Standard Templates
Investor-Approved Valuation Models
MAC/PC Compatible, Fully Unlocked
No Expertise Is Needed; Easy To Follow
ShenZhen Click Technology Co.,LTD. (002782.SZ) Bundle
Verbessern Sie Ihre Anlagestrategien mit dem [Symbol] DCF -Taschenrechner! Tauchen Sie in reale Finanzdaten für Shenzhen Click Technology Co., Ltd., Passen Sie Wachstumsprojektionen und -kosten an und beobachten Sie sofort, wie sich diese Modifikationen auf den intrinsischen Wert auswirken.
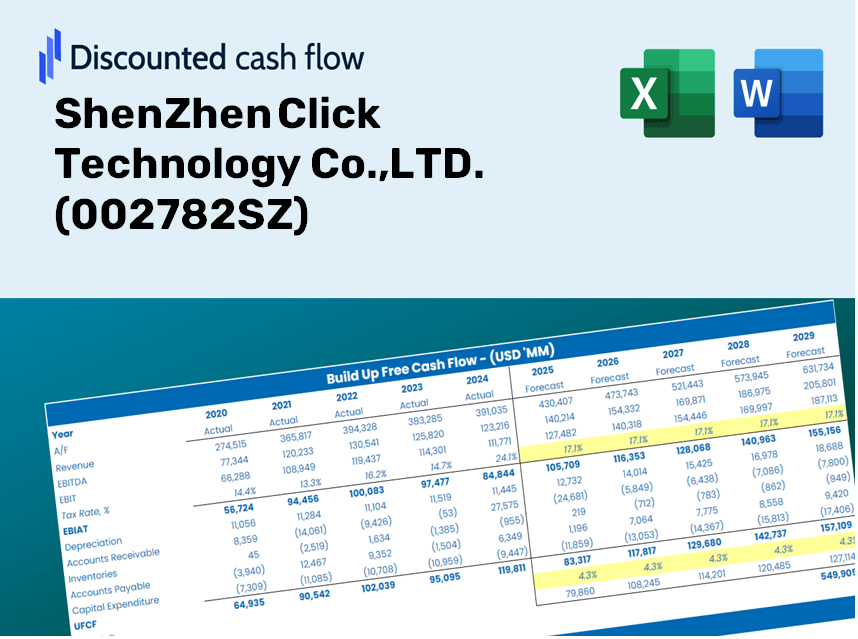
Discounted Cash Flow (DCF) - (USD MM)
| Year | AY1 2020 |
AY2 2021 |
AY3 2022 |
AY4 2023 |
AY5 2024 |
FY1 2025 |
FY2 2026 |
FY3 2027 |
FY4 2028 |
FY5 2029 |
|---|---|---|---|---|---|---|---|---|---|---|
| Revenue | 1,279.9 | 1,648.9 | 3,267.7 | 4,668.1 | 4,693.5 | 6,692.9 | 9,544.2 | 13,610.1 | 19,408.1 | 27,676.2 |
| Revenue Growth, % | 0 | 28.83 | 98.17 | 42.86 | 0.54347 | 42.6 | 42.6 | 42.6 | 42.6 | 42.6 |
| EBITDA | 163.4 | 97.9 | 258.4 | 278.1 | 288.9 | 518.4 | 739.2 | 1,054.1 | 1,503.1 | 2,143.5 |
| EBITDA, % | 12.77 | 5.94 | 7.91 | 5.96 | 6.16 | 7.74 | 7.74 | 7.74 | 7.74 | 7.74 |
| Depreciation | 25.9 | 27.6 | 42.0 | 57.6 | 64.8 | 101.7 | 145.0 | 206.8 | 294.9 | 420.6 |
| Depreciation, % | 2.02 | 1.67 | 1.28 | 1.23 | 1.38 | 1.52 | 1.52 | 1.52 | 1.52 | 1.52 |
| EBIT | 137.5 | 70.2 | 216.4 | 220.4 | 224.1 | 416.7 | 594.2 | 847.3 | 1,208.2 | 1,722.9 |
| EBIT, % | 10.75 | 4.26 | 6.62 | 4.72 | 4.78 | 6.23 | 6.23 | 6.23 | 6.23 | 6.23 |
| Total Cash | 876.2 | 454.1 | 306.8 | 550.2 | 661.5 | 1,757.1 | 2,505.6 | 3,573.0 | 5,095.1 | 7,265.7 |
| Total Cash, percent | .0 | .0 | .0 | .0 | .0 | .0 | .0 | .0 | .0 | .0 |
| Account Receivables | 356.5 | 512.6 | 1,808.7 | 1,950.6 | 2,000.6 | 2,659.8 | 3,792.9 | 5,408.8 | 7,713.0 | 10,998.8 |
| Account Receivables, % | 27.86 | 31.09 | 55.35 | 41.78 | 42.62 | 39.74 | 39.74 | 39.74 | 39.74 | 39.74 |
| Inventories | 171.1 | 311.7 | 604.6 | 551.0 | 582.4 | 1,003.7 | 1,431.3 | 2,041.0 | 2,910.5 | 4,150.4 |
| Inventories, % | 13.36 | 18.9 | 18.5 | 11.8 | 12.41 | 15 | 15 | 15 | 15 | 15 |
| Accounts Payable | 332.5 | 252.7 | 1,416.5 | 1,454.6 | 1,715.7 | 2,039.5 | 2,908.4 | 4,147.4 | 5,914.2 | 8,433.7 |
| Accounts Payable, % | 25.98 | 15.32 | 43.35 | 31.16 | 36.56 | 30.47 | 30.47 | 30.47 | 30.47 | 30.47 |
| Capital Expenditure | -54.0 | -70.3 | -113.8 | -136.7 | -101.2 | -228.2 | -325.5 | -464.1 | -661.9 | -943.8 |
| Capital Expenditure, % | -4.22 | -4.26 | -3.48 | -2.93 | -2.16 | -3.41 | -3.41 | -3.41 | -3.41 | -3.41 |
| Tax Rate, % | 8.09 | 8.09 | 8.09 | 8.09 | 8.09 | 8.09 | 8.09 | 8.09 | 8.09 | 8.09 |
| EBITAT | 117.3 | 137.1 | 158.8 | 148.6 | 206.0 | 348.3 | 496.7 | 708.3 | 1,010.1 | 1,440.4 |
| Depreciation | ||||||||||
| Changes in Account Receivables | ||||||||||
| Changes in Inventories | ||||||||||
| Changes in Accounts Payable | ||||||||||
| Capital Expenditure | ||||||||||
| UFCF | -105.9 | -282.1 | -338.2 | 19.5 | 349.3 | -535.0 | -375.6 | -535.6 | -763.7 | -1,089.1 |
| WACC, % | 6.67 | 6.69 | 6.65 | 6.65 | 6.68 | 6.67 | 6.67 | 6.67 | 6.67 | 6.67 |
| PV UFCF | ||||||||||
| SUM PV UFCF | -2,651.6 | |||||||||
| Long Term Growth Rate, % | 3.50 | |||||||||
| Free cash flow (T + 1) | -1,127 | |||||||||
| Terminal Value | -35,600 | |||||||||
| Present Terminal Value | -25,782 | |||||||||
| Enterprise Value | -28,434 | |||||||||
| Net Debt | -517 | |||||||||
| Equity Value | -27,917 | |||||||||
| Diluted Shares Outstanding, MM | 488 | |||||||||
| Equity Value Per Share | -57.16 |
Benefits You Will Receive
- Comprehensive Financial Model: Leverage ShenZhen Click Technology’s actual data for accurate DCF valuation.
- Complete Control Over Projections: Modify revenue growth rates, profit margins, WACC, and other essential factors.
- Real-Time Calculations: Automated updates show immediate results as you adjust inputs.
- Professional-Grade Template: A polished Excel file tailored for credible valuation presentations.
- Flexible and Reusable: Designed for adaptability, enabling repeated use for in-depth forecasting.
Core Benefits
- Accurate Financial Data for ShenZhen Click Technology: Gain access to precise historical records and future forecasts tailored for (002782SZ).
- Tailorable Forecast Parameters: Modify highlighted cells for key factors like WACC, growth rates, and profit margins.
- Instantaneous Calculations: Features automatic adjustments for DCF, Net Present Value (NPV), and cash flow assessments.
- Interactive Dashboard: User-friendly graphs and summaries to clearly illustrate your valuation findings.
- Designed for All Skill Levels: An intuitive layout perfect for investors, CFOs, and consultants alike.
How It Works
- Step 1: Download the Excel file.
- Step 2: Review the pre-entered data for ShenZhen Click Technology Co., LTD. (002782SZ) including historical and projected figures.
- Step 3: Modify key assumptions (highlighted in yellow) based on your analysis.
- Step 4: Observe automatic recalculations for the intrinsic value of ShenZhen Click Technology Co., LTD. (002782SZ).
- Step 5: Utilize the results for investment decisions or reporting purposes.
Why Opt for ShenZhen Click Technology’s Calculator?
- Accurate Data: Access reliable valuation results based on real financials from ShenZhen Click Technology Co.,LTD. (002782SZ).
- Customizable: Tailor key parameters such as growth rates, WACC, and tax rates to align with your forecasts.
- Time-Efficient: Pre-configured calculations save you the hassle of starting from the ground up.
- Professional Tool: Specifically crafted for investors, analysts, and consultants.
- User-Friendly: Easy to navigate design and step-by-step guidance cater to users of all experience levels.
Who Can Benefit from Our Products?
- Tech Enthusiasts: Discover cutting-edge technology trends and their applications in real-world scenarios.
- Researchers: Utilize our tools for in-depth analysis and incorporation into academic studies.
- Investors: Assess your investment strategies and evaluate performance trends for ShenZhen Click Technology Co.,LTD. (002782SZ).
- Market Analysts: Enhance your analysis process with our customizable data models.
- Entrepreneurs: Learn from the operational strategies of established tech firms like ShenZhen Click Technology Co.,LTD. (002782SZ).
Contents of the Template
- Pre-Filled DCF Model: ShenZhen Click Technology Co., LTD.'s financial data preloaded for quick access.
- WACC Calculator: Comprehensive calculations for the Weighted Average Cost of Capital.
- Financial Ratios: Assess ShenZhen Click's profitability, leverage, and operational efficiency.
- Editable Inputs: Adjust assumptions such as growth rates, profit margins, and capital expenditures to align with your analysis.
- Financial Statements: Access annual and quarterly reports to support in-depth evaluations.
- Interactive Dashboard: Effortlessly visualize key valuation metrics and outcomes.
Disclaimer
All information, articles, and product details provided on this website are for general informational and educational purposes only. We do not claim any ownership over, nor do we intend to infringe upon, any trademarks, copyrights, logos, brand names, or other intellectual property mentioned or depicted on this site. Such intellectual property remains the property of its respective owners, and any references here are made solely for identification or informational purposes, without implying any affiliation, endorsement, or partnership.
We make no representations or warranties, express or implied, regarding the accuracy, completeness, or suitability of any content or products presented. Nothing on this website should be construed as legal, tax, investment, financial, medical, or other professional advice. In addition, no part of this site—including articles or product references—constitutes a solicitation, recommendation, endorsement, advertisement, or offer to buy or sell any securities, franchises, or other financial instruments, particularly in jurisdictions where such activity would be unlawful.
All content is of a general nature and may not address the specific circumstances of any individual or entity. It is not a substitute for professional advice or services. Any actions you take based on the information provided here are strictly at your own risk. You accept full responsibility for any decisions or outcomes arising from your use of this website and agree to release us from any liability in connection with your use of, or reliance upon, the content or products found herein.