
|
Biem.l.fdlkk garment Co., Ltd. (002832.sz) DCF -Bewertung |
Fully Editable: Tailor To Your Needs In Excel Or Sheets
Professional Design: Trusted, Industry-Standard Templates
Investor-Approved Valuation Models
MAC/PC Compatible, Fully Unlocked
No Expertise Is Needed; Easy To Follow
BIEM.L.FDLKK Garment Co.,Ltd. (002832.SZ) Bundle
Vereinfachen Sie die Bewertung von Biem.L.Fdlkk G darauf, Ltd. (002832SZ) mit diesem anpassbaren DCF -Taschenrechner! Mit Real Biem.L.Fdlkk Gardment Co., Ltd. (002832SZ) Finanzdaten und einstellbaren Prognoseeingängen können Sie Szenarien testen und Biem.l.fdlkk Bewerber Co., Ltd. (002832SZ) in wenigen Minuten.
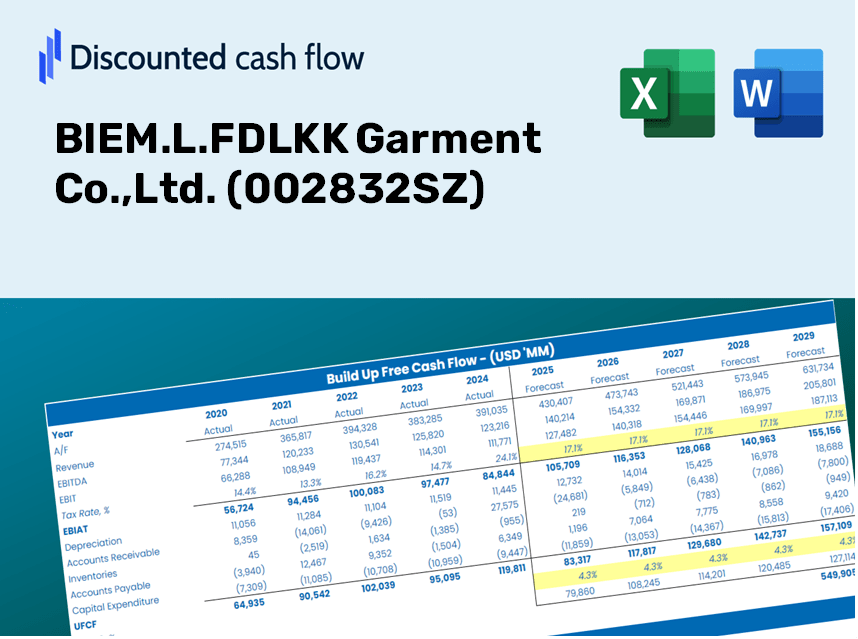
Discounted Cash Flow (DCF) - (USD MM)
| Year | AY1 2020 |
AY2 2021 |
AY3 2022 |
AY4 2023 |
AY5 2024 |
FY1 2025 |
FY2 2026 |
FY3 2027 |
FY4 2028 |
FY5 2029 |
|---|---|---|---|---|---|---|---|---|---|---|
| Revenue | 2,303.3 | 2,720.0 | 2,884.8 | 3,536.1 | 4,004.5 | 4,604.8 | 5,295.2 | 6,089.1 | 7,002.1 | 8,051.9 |
| Revenue Growth, % | 0 | 18.09 | 6.06 | 22.58 | 13.24 | 14.99 | 14.99 | 14.99 | 14.99 | 14.99 |
| EBITDA | 695.2 | 1,066.2 | 1,119.9 | 1,371.4 | 1,325.0 | 1,658.4 | 1,907.1 | 2,193.0 | 2,521.8 | 2,899.9 |
| EBITDA, % | 30.18 | 39.2 | 38.82 | 38.78 | 33.09 | 36.02 | 36.02 | 36.02 | 36.02 | 36.02 |
| Depreciation | 93.6 | 293.6 | 331.7 | 312.7 | 352.3 | 405.2 | 465.9 | 535.8 | 616.1 | 708.5 |
| Depreciation, % | 4.06 | 10.79 | 11.5 | 8.84 | 8.8 | 8.8 | 8.8 | 8.8 | 8.8 | 8.8 |
| EBIT | 601.7 | 772.6 | 788.2 | 1,058.8 | 972.7 | 1,253.2 | 1,441.1 | 1,657.2 | 1,905.7 | 2,191.4 |
| EBIT, % | 26.12 | 28.41 | 27.32 | 29.94 | 24.29 | 27.22 | 27.22 | 27.22 | 27.22 | 27.22 |
| Total Cash | 679.2 | 1,717.5 | 2,523.5 | 2,932.4 | 2,452.0 | 2,986.3 | 3,434.1 | 3,948.9 | 4,541.0 | 5,221.8 |
| Total Cash, percent | .0 | .0 | .0 | .0 | .0 | .0 | .0 | .0 | .0 | .0 |
| Account Receivables | 456.1 | 369.6 | 324.7 | 413.2 | 466.9 | 626.2 | 720.0 | 828.0 | 952.1 | 1,094.9 |
| Account Receivables, % | 19.8 | 13.59 | 11.25 | 11.69 | 11.66 | 13.6 | 13.6 | 13.6 | 13.6 | 13.6 |
| Inventories | 607.7 | 660.2 | 745.6 | 707.7 | 950.6 | 1,107.5 | 1,273.5 | 1,464.5 | 1,684.0 | 1,936.5 |
| Inventories, % | 26.38 | 24.27 | 25.85 | 20.01 | 23.74 | 24.05 | 24.05 | 24.05 | 24.05 | 24.05 |
| Accounts Payable | 134.8 | 164.6 | 231.3 | 259.8 | 437.6 | 351.8 | 404.5 | 465.2 | 534.9 | 615.1 |
| Accounts Payable, % | 5.85 | 6.05 | 8.02 | 7.35 | 10.93 | 7.64 | 7.64 | 7.64 | 7.64 | 7.64 |
| Capital Expenditure | -95.3 | -215.6 | -499.1 | -899.4 | -557.1 | -632.8 | -727.7 | -836.8 | -962.2 | -1,106.5 |
| Capital Expenditure, % | -4.14 | -7.93 | -17.3 | -25.44 | -13.91 | -13.74 | -13.74 | -13.74 | -13.74 | -13.74 |
| Tax Rate, % | 17.54 | 17.54 | 17.54 | 17.54 | 17.54 | 17.54 | 17.54 | 17.54 | 17.54 | 17.54 |
| EBITAT | 512.9 | 658.6 | 670.2 | 910.8 | 802.1 | 1,062.8 | 1,222.1 | 1,405.3 | 1,616.0 | 1,858.3 |
| Depreciation | ||||||||||
| Changes in Account Receivables | ||||||||||
| Changes in Inventories | ||||||||||
| Changes in Accounts Payable | ||||||||||
| Capital Expenditure | ||||||||||
| UFCF | -417.7 | 800.3 | 529.1 | 302.0 | 478.4 | 433.2 | 753.2 | 866.1 | 996.0 | 1,145.3 |
| WACC, % | 4.91 | 4.91 | 4.91 | 4.91 | 4.9 | 4.91 | 4.91 | 4.91 | 4.91 | 4.91 |
| PV UFCF | ||||||||||
| SUM PV UFCF | 3,571.0 | |||||||||
| Long Term Growth Rate, % | 3.50 | |||||||||
| Free cash flow (T + 1) | 1,185 | |||||||||
| Terminal Value | 84,141 | |||||||||
| Present Terminal Value | 66,213 | |||||||||
| Enterprise Value | 69,784 | |||||||||
| Net Debt | -906 | |||||||||
| Equity Value | 70,691 | |||||||||
| Diluted Shares Outstanding, MM | 570 | |||||||||
| Equity Value Per Share | 124.05 |
What You Will Receive
- Adjustable Forecast Parameters: Easily modify assumptions (growth %, profit margins, discount rate) to explore various scenarios.
- Market-Driven Data: BIEM.L.FDLKK Garment Co.,Ltd.'s (002832SZ) financial information pre-loaded to facilitate your analysis.
- Automated DCF Calculations: The model swiftly computes Net Present Value (NPV) and intrinsic value on your behalf.
- Tailor-Made and Professional: A refined Excel framework that aligns with your valuation requirements.
- Designed for Analysts and Investors: Perfect for testing forecasts, confirming strategies, and enhancing efficiency.
Key Features
- Pre-Loaded Data: Historical financial statements and pre-filled forecasts for BIEM.L.FDLKK Garment Co.,Ltd. (002832SZ).
- Fully Adjustable Inputs: Customize WACC, tax rates, revenue growth, and EBITDA margins to fit your analysis.
- Instant Results: Observe real-time recalculations of BIEM.L.FDLKK's intrinsic value.
- Clear Visual Outputs: Dashboard charts provide easy-to-read valuation results and essential metrics.
- Built for Accuracy: A comprehensive tool designed for analysts, investors, and finance professionals.
How It Functions
- Download the Template: Gain immediate access to the Excel-based BIEM.L.FDLKK DCF Calculator.
- Input Your Assumptions: Modify the yellow-highlighted cells for growth rates, WACC, profit margins, and other variables.
- Instant Calculations: The model automatically refreshes the intrinsic value of BIEM.L.FDLKK based on your inputs.
- Test Scenarios: Experiment with various assumptions to assess potential changes in valuation.
- Analyze and Decide: Utilize the outcomes to inform your investment strategy or financial analysis.
Why Opt for BIEM.L.FDLKK Garment Co.,Ltd. (002832SZ) Calculator?
- Precise Data: Utilize accurate financial figures from BIEM.L.FDLKK for trustworthy valuation outcomes.
- Tailorable: Modify essential inputs such as growth rates, WACC, and tax rates to fit your forecasts.
- Efficiency Boost: Built-in calculations save you the effort of starting from the ground up.
- Expert-Level Tool: Crafted for investors, analysts, and consultants in the garment industry.
- Easy to Use: User-friendly interface and clear, step-by-step guidance cater to all levels of experience.
Who Should Utilize This Product?
- Investors: Accurately assess the fair value of BIEM.L.FDLKK Garment Co.,Ltd. (002832SZ) before making investment choices.
- CFOs: Utilize a professional-grade DCF model for precise financial reporting and analysis.
- Consultants: Efficiently customize the template for client valuation reports.
- Entrepreneurs: Acquire insights into financial modeling techniques employed by leading garment companies.
- Educators: Implement it as a teaching resource to illustrate valuation methodologies.
Contents of the Template
- Preloaded BIEM.L.FDLKK Data: Historical and forecasted financial metrics, such as revenue, EBIT, and capital expenditures.
- DCF and WACC Models: Advanced spreadsheets designed for calculating intrinsic value and Weighted Average Cost of Capital.
- Editable Inputs: Cells highlighted in yellow for modifying growth rates, tax percentages, and discount rates.
- Financial Statements: Detailed annual and quarterly financial statements for thorough analysis.
- Key Ratios: Metrics focusing on profitability, leverage, and efficiency to assess performance.
- Dashboard and Charts: Visual representations of valuation results and underlying assumptions.
Disclaimer
All information, articles, and product details provided on this website are for general informational and educational purposes only. We do not claim any ownership over, nor do we intend to infringe upon, any trademarks, copyrights, logos, brand names, or other intellectual property mentioned or depicted on this site. Such intellectual property remains the property of its respective owners, and any references here are made solely for identification or informational purposes, without implying any affiliation, endorsement, or partnership.
We make no representations or warranties, express or implied, regarding the accuracy, completeness, or suitability of any content or products presented. Nothing on this website should be construed as legal, tax, investment, financial, medical, or other professional advice. In addition, no part of this site—including articles or product references—constitutes a solicitation, recommendation, endorsement, advertisement, or offer to buy or sell any securities, franchises, or other financial instruments, particularly in jurisdictions where such activity would be unlawful.
All content is of a general nature and may not address the specific circumstances of any individual or entity. It is not a substitute for professional advice or services. Any actions you take based on the information provided here are strictly at your own risk. You accept full responsibility for any decisions or outcomes arising from your use of this website and agree to release us from any liability in connection with your use of, or reliance upon, the content or products found herein.