
|
Keli Motor Group Co., Ltd. (002892.Sz) DCF -Bewertung |
Fully Editable: Tailor To Your Needs In Excel Or Sheets
Professional Design: Trusted, Industry-Standard Templates
Investor-Approved Valuation Models
MAC/PC Compatible, Fully Unlocked
No Expertise Is Needed; Easy To Follow
Keli Motor Group Co., Ltd. (002892.SZ) Bundle
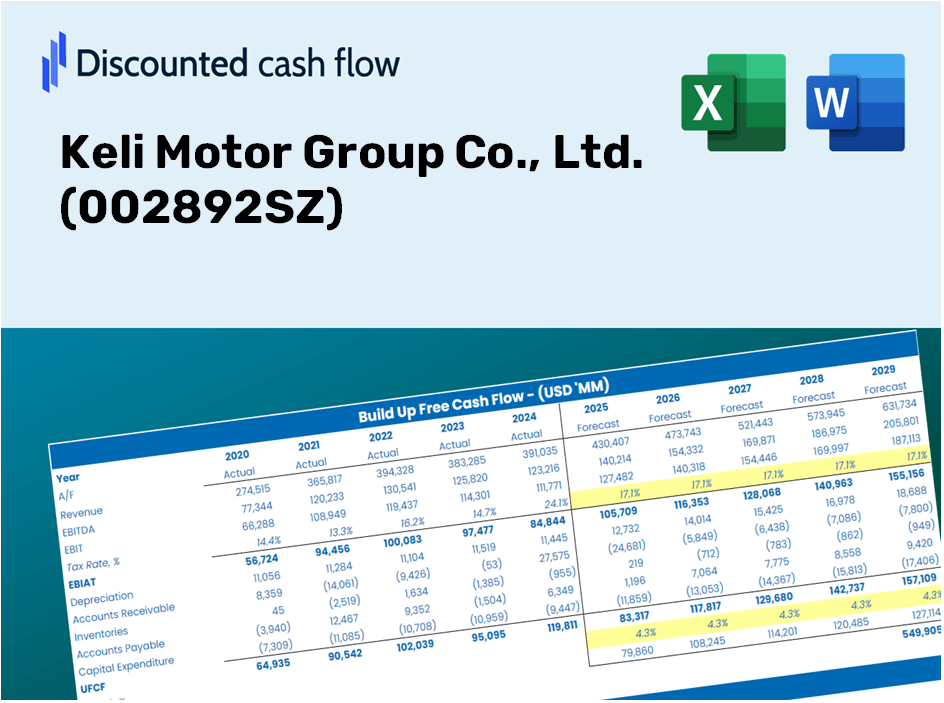
Gewinnen Sie Einblicke in Ihre Keli Motor Group Co., Ltd. (002892SZ) Bewertungsanalyse mit unserem ausgefeilten DCF -Taschenrechner! Diese Excel -Vorlage wird mit realen (002892SZ) Daten vorinstalliert, sodass Sie Prognosen und Annahmen für eine genaue Berechnung des intrinsischen Wertes der Keli Motor Group anpassen können.
Discounted Cash Flow (DCF) - (USD MM)
| Year | AY1 2020 |
AY2 2021 |
AY3 2022 |
AY4 2023 |
AY5 2024 |
FY1 2025 |
FY2 2026 |
FY3 2027 |
FY4 2028 |
FY5 2029 |
|---|---|---|---|---|---|---|---|---|---|---|
| Revenue | 993.2 | 1,434.5 | 1,183.4 | 1,295.3 | 1,656.5 | 1,922.7 | 2,231.6 | 2,590.2 | 3,006.4 | 3,489.4 |
| Revenue Growth, % | 0 | 44.44 | -17.5 | 9.45 | 27.89 | 16.07 | 16.07 | 16.07 | 16.07 | 16.07 |
| EBITDA | 125.3 | 138.8 | 68.9 | 91.1 | 95.1 | 157.2 | 182.5 | 211.8 | 245.8 | 285.3 |
| EBITDA, % | 12.61 | 9.68 | 5.82 | 7.04 | 5.74 | 8.18 | 8.18 | 8.18 | 8.18 | 8.18 |
| Depreciation | 18.5 | 24.5 | 31.4 | 35.2 | 36.9 | 42.9 | 49.8 | 57.8 | 67.1 | 77.9 |
| Depreciation, % | 1.86 | 1.71 | 2.65 | 2.72 | 2.23 | 2.23 | 2.23 | 2.23 | 2.23 | 2.23 |
| EBIT | 106.8 | 114.3 | 37.5 | 55.9 | 58.3 | 114.3 | 132.7 | 154.0 | 178.7 | 207.4 |
| EBIT, % | 10.75 | 7.97 | 3.17 | 4.32 | 3.52 | 5.94 | 5.94 | 5.94 | 5.94 | 5.94 |
| Total Cash | 215.4 | 555.3 | 535.3 | 481.5 | 498.8 | 664.9 | 771.8 | 895.8 | 1,039.7 | 1,206.8 |
| Total Cash, percent | .0 | .0 | .0 | .0 | .0 | .0 | .0 | .0 | .0 | .0 |
| Account Receivables | 248.4 | 351.5 | 343.2 | 361.6 | 523.4 | 530.8 | 616.1 | 715.0 | 829.9 | 963.3 |
| Account Receivables, % | 25.01 | 24.5 | 29 | 27.91 | 31.59 | 27.61 | 27.61 | 27.61 | 27.61 | 27.61 |
| Inventories | 172.3 | 295.5 | 226.2 | 226.9 | 294.7 | 355.2 | 412.3 | 478.5 | 555.4 | 644.6 |
| Inventories, % | 17.35 | 20.6 | 19.11 | 17.52 | 17.79 | 18.47 | 18.47 | 18.47 | 18.47 | 18.47 |
| Accounts Payable | 162.5 | 232.7 | 211.1 | 303.3 | 632.1 | 430.7 | 499.9 | 580.2 | 673.4 | 781.6 |
| Accounts Payable, % | 16.36 | 16.22 | 17.83 | 23.42 | 38.16 | 22.4 | 22.4 | 22.4 | 22.4 | 22.4 |
| Capital Expenditure | -55.5 | -73.3 | -158.2 | -245.6 | -257.2 | -225.2 | -261.4 | -303.4 | -352.1 | -408.7 |
| Capital Expenditure, % | -5.59 | -5.11 | -13.37 | -18.96 | -15.53 | -11.71 | -11.71 | -11.71 | -11.71 | -11.71 |
| Tax Rate, % | -15.99 | -15.99 | -15.99 | -15.99 | -15.99 | -15.99 | -15.99 | -15.99 | -15.99 | -15.99 |
| EBITAT | 93.5 | 103.8 | 36.6 | 54.4 | 67.6 | 108.2 | 125.6 | 145.8 | 169.2 | 196.4 |
| Depreciation | ||||||||||
| Changes in Account Receivables | ||||||||||
| Changes in Inventories | ||||||||||
| Changes in Accounts Payable | ||||||||||
| Capital Expenditure | ||||||||||
| UFCF | -201.8 | -101.1 | -34.3 | -82.8 | -53.6 | -343.4 | -159.1 | -184.7 | -214.4 | -248.8 |
| WACC, % | 8.15 | 8.15 | 8.16 | 8.16 | 8.16 | 8.16 | 8.16 | 8.16 | 8.16 | 8.16 |
| PV UFCF | ||||||||||
| SUM PV UFCF | -924.3 | |||||||||
| Long Term Growth Rate, % | 4.00 | |||||||||
| Free cash flow (T + 1) | -259 | |||||||||
| Terminal Value | -6,227 | |||||||||
| Present Terminal Value | -4,208 | |||||||||
| Enterprise Value | -5,132 | |||||||||
| Net Debt | -220 | |||||||||
| Equity Value | -4,912 | |||||||||
| Diluted Shares Outstanding, MM | 620 | |||||||||
| Equity Value Per Share | -7.92 |
Benefits You Will Receive
- Genuine KMG Financial Data: Access to historical and projected information for precise valuation.
- Customizable Parameters: Adjust metrics such as WACC, tax rates, revenue growth, and capital expenditures.
- Instantaneous Calculations: Intrinsic value and NPV are computed in real-time.
- Scenario Exploration: Evaluate various scenarios to analyze the future performance of Keli Motor Group (002892SZ).
- User-Friendly Design: Tailored for industry professionals while remaining approachable for newcomers.
Key Features
- Comprehensive Data Access: Historical financial records and pre-populated forecasts for Keli Motor Group Co., Ltd. (002892SZ).
- Customizable Parameters: Modify WACC, tax rates, revenue growth rates, and EBITDA margins as needed.
- Real-Time Calculations: Instantly view the recalculated intrinsic value for Keli Motor Group Co., Ltd. (002892SZ).
- Intuitive Visualizations: Graphs and charts on the dashboard present valuation outcomes and essential metrics.
- Engineered for Precision: A professional-grade tool designed for analysts, investors, and finance professionals.
How It Works
- Step 1: Download the Excel file for Keli Motor Group Co., Ltd. (002892SZ).
- Step 2: Examine the pre-filled financial data and forecasts for Keli Motor Group.
- Step 3: Adjust key inputs such as revenue growth, WACC, and tax rates (highlighted cells).
- Step 4: Observe the DCF model update in real-time as you modify assumptions.
- Step 5: Evaluate the outputs and leverage the results for your investment strategies.
Why Opt for Keli Motor Group's Calculator?
- Reliable Data: Utilize actual financials from Keli Motor Group (002892SZ) for trustworthy valuation outcomes.
- Tailored Features: Modify essential parameters such as growth rates, WACC, and tax rates to suit your forecasts.
- Efficiency Boost: Built-in calculations save you the hassle of starting from the ground up.
- Expert-Quality Tool: Crafted for investors, analysts, and business consultants.
- User-Centric: A straightforward design and clear, step-by-step guidance cater to all skill levels.
Who Can Benefit from Keli Motor Group Co., Ltd. (002892SZ)?
- Investors: Make informed choices with our comprehensive valuation resources.
- Financial Analysts: Streamline your workflow with our customizable financial models.
- Consultants: Easily tailor our templates for impactful client presentations and reports.
- Automotive Enthusiasts: Enhance your knowledge of the industry with practical insights and examples.
- Educators and Students: Utilize our resources as a hands-on tool in finance and business courses.
Contents of the Template
- Pre-Filled Data: Contains Keli Motor Group's historical financial information and projections.
- Discounted Cash Flow Model: A customizable DCF valuation model featuring automatic calculations.
- Weighted Average Cost of Capital (WACC): A dedicated worksheet for calculating WACC based on user-defined inputs.
- Key Financial Ratios: Evaluate Keli Motor Group's profitability, efficiency, and leverage metrics.
- Customizable Inputs: Easily adjust revenue growth, profit margins, and tax rates.
- Clear Dashboard: Visual representations and tables that summarize essential valuation outcomes.
Disclaimer
All information, articles, and product details provided on this website are for general informational and educational purposes only. We do not claim any ownership over, nor do we intend to infringe upon, any trademarks, copyrights, logos, brand names, or other intellectual property mentioned or depicted on this site. Such intellectual property remains the property of its respective owners, and any references here are made solely for identification or informational purposes, without implying any affiliation, endorsement, or partnership.
We make no representations or warranties, express or implied, regarding the accuracy, completeness, or suitability of any content or products presented. Nothing on this website should be construed as legal, tax, investment, financial, medical, or other professional advice. In addition, no part of this site—including articles or product references—constitutes a solicitation, recommendation, endorsement, advertisement, or offer to buy or sell any securities, franchises, or other financial instruments, particularly in jurisdictions where such activity would be unlawful.
All content is of a general nature and may not address the specific circumstances of any individual or entity. It is not a substitute for professional advice or services. Any actions you take based on the information provided here are strictly at your own risk. You accept full responsibility for any decisions or outcomes arising from your use of this website and agree to release us from any liability in connection with your use of, or reliance upon, the content or products found herein.