
|
Eaglerise Electric & Electronic Co., Ltd (002922.SZ) DCF -Bewertung |
Fully Editable: Tailor To Your Needs In Excel Or Sheets
Professional Design: Trusted, Industry-Standard Templates
Investor-Approved Valuation Models
MAC/PC Compatible, Fully Unlocked
No Expertise Is Needed; Easy To Follow
Eaglerise Electric & Electronic (China) Co., Ltd (002922.SZ) Bundle
Maximieren Sie die Effizienz und verbessern Sie die Präzision mit unserem DCF -Taschenrechner (002922SZ)! Verwendung authentischer Daten von Eaglerise Electric & Electronic (China) Co., Ltd, zusammen mit anpassbaren Annahmen ermöglicht es Ihnen, genau wie ein erfahrener Investor prognostiziert, analysieren und value (002922SZ).
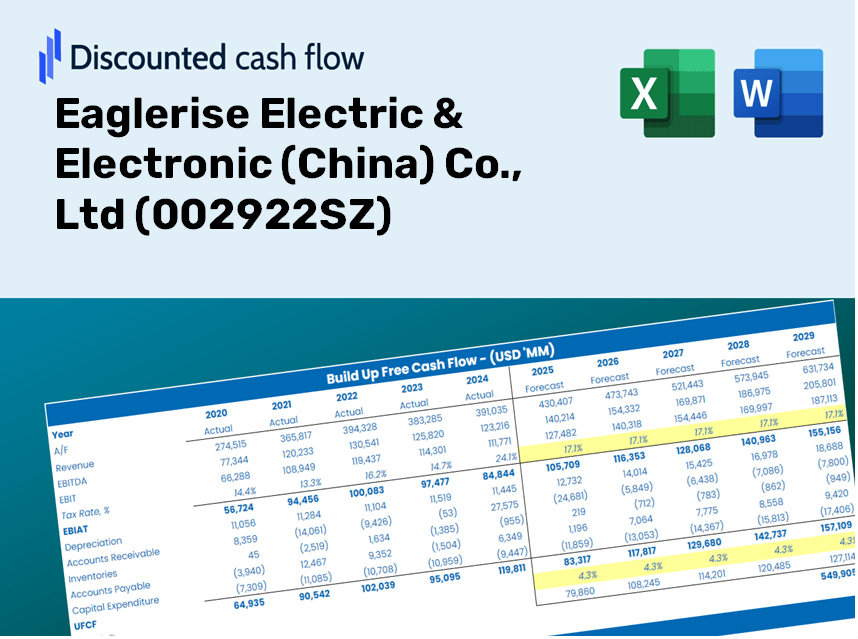
Discounted Cash Flow (DCF) - (USD MM)
| Year | AY1 2020 |
AY2 2021 |
AY3 2022 |
AY4 2023 |
AY5 2024 |
FY1 2025 |
FY2 2026 |
FY3 2027 |
FY4 2028 |
FY5 2029 |
|---|---|---|---|---|---|---|---|---|---|---|
| Revenue | 1,406.0 | 2,230.1 | 2,821.1 | 3,630.3 | 4,638.8 | 6,280.7 | 8,503.6 | 11,513.3 | 15,588.3 | 21,105.5 |
| Revenue Growth, % | 0 | 58.61 | 26.5 | 28.68 | 27.78 | 35.39 | 35.39 | 35.39 | 35.39 | 35.39 |
| EBITDA | 94.2 | 275.8 | 275.0 | 345.9 | 510.4 | 619.8 | 839.1 | 1,136.1 | 1,538.2 | 2,082.7 |
| EBITDA, % | 6.7 | 12.36 | 9.75 | 9.53 | 11 | 9.87 | 9.87 | 9.87 | 9.87 | 9.87 |
| Depreciation | 36.2 | 48.2 | 60.2 | 90.4 | 120.2 | 150.1 | 203.2 | 275.2 | 372.5 | 504.4 |
| Depreciation, % | 2.57 | 2.16 | 2.13 | 2.49 | 2.59 | 2.39 | 2.39 | 2.39 | 2.39 | 2.39 |
| EBIT | 58.0 | 227.6 | 214.8 | 255.5 | 390.2 | 469.7 | 635.9 | 861.0 | 1,165.7 | 1,578.3 |
| EBIT, % | 4.13 | 10.2 | 7.61 | 7.04 | 8.41 | 7.48 | 7.48 | 7.48 | 7.48 | 7.48 |
| Total Cash | 744.7 | 398.7 | 516.2 | 1,274.3 | 838.9 | 1,787.8 | 2,420.5 | 3,277.3 | 4,437.2 | 6,007.7 |
| Total Cash, percent | .0 | .0 | .0 | .0 | .0 | .0 | .0 | .0 | .0 | .0 |
| Account Receivables | 512.2 | 931.5 | 1,245.3 | 1,801.7 | 2,401.7 | 2,810.5 | 3,805.3 | 5,152.1 | 6,975.6 | 9,444.5 |
| Account Receivables, % | 36.43 | 41.77 | 44.14 | 49.63 | 51.77 | 44.75 | 44.75 | 44.75 | 44.75 | 44.75 |
| Inventories | 243.2 | 416.9 | 366.1 | 483.2 | 733.5 | 980.9 | 1,328.1 | 1,798.2 | 2,434.6 | 3,296.3 |
| Inventories, % | 17.3 | 18.69 | 12.98 | 13.31 | 15.81 | 15.62 | 15.62 | 15.62 | 15.62 | 15.62 |
| Accounts Payable | 421.3 | 755.9 | 1,003.2 | 1,160.0 | 1,292.3 | 2,000.2 | 2,708.1 | 3,666.6 | 4,964.3 | 6,721.3 |
| Accounts Payable, % | 29.96 | 33.89 | 35.56 | 31.95 | 27.86 | 31.85 | 31.85 | 31.85 | 31.85 | 31.85 |
| Capital Expenditure | -98.9 | -157.4 | -255.6 | -549.6 | -1,748.3 | -954.4 | -1,292.1 | -1,749.5 | -2,368.7 | -3,207.0 |
| Capital Expenditure, % | -7.03 | -7.06 | -9.06 | -15.14 | -37.69 | -15.2 | -15.2 | -15.2 | -15.2 | -15.2 |
| Tax Rate, % | 15.69 | 15.69 | 15.69 | 15.69 | 15.69 | 15.69 | 15.69 | 15.69 | 15.69 | 15.69 |
| EBITAT | 59.3 | 207.4 | 205.3 | 235.9 | 329.0 | 435.3 | 589.3 | 797.9 | 1,080.3 | 1,462.7 |
| Depreciation | ||||||||||
| Changes in Account Receivables | ||||||||||
| Changes in Inventories | ||||||||||
| Changes in Accounts Payable | ||||||||||
| Capital Expenditure | ||||||||||
| UFCF | -337.5 | -160.3 | -5.7 | -740.0 | -2,017.0 | -317.5 | -1,133.6 | -1,534.8 | -2,078.0 | -2,813.5 |
| WACC, % | 5.03 | 4.96 | 4.99 | 4.97 | 4.9 | 4.97 | 4.97 | 4.97 | 4.97 | 4.97 |
| PV UFCF | ||||||||||
| SUM PV UFCF | -6,577.6 | |||||||||
| Long Term Growth Rate, % | 3.50 | |||||||||
| Free cash flow (T + 1) | -2,912 | |||||||||
| Terminal Value | -198,229 | |||||||||
| Present Terminal Value | -155,547 | |||||||||
| Enterprise Value | -162,125 | |||||||||
| Net Debt | 1,515 | |||||||||
| Equity Value | -163,640 | |||||||||
| Diluted Shares Outstanding, MM | 390 | |||||||||
| Equity Value Per Share | -419.56 |
What You Can Expect
- Authentic Eaglerise Financial Data: Pre-loaded with historical and projected data for accurate analysis.
- Completely Customizable Template: Easily adjust key variables such as revenue growth, WACC, and EBITDA percentage.
- Instant Calculations: Watch the intrinsic value of Eaglerise update immediately as you make changes.
- Expert Valuation Tool: Tailored for investors, analysts, and consultants aiming for precise DCF outcomes.
- Intuitive Design: A straightforward structure with clear guidance suitable for all skill levels.
Key Features
- Customizable Forecast Parameters: Adjust essential inputs such as revenue growth, EBITDA percentage, and capital expenditures.
- Instant DCF Valuation: Automatically computes intrinsic value, NPV, and additional metrics effortlessly.
- Industry-Leading Accuracy: Leverages Eaglerise’s actual financial data for precise valuation results.
- Streamlined Scenario Analysis: Effortlessly test various assumptions and evaluate different outcomes.
- Efficiency Booster: Avoid the hassle of creating intricate valuation models from the ground up.
How It Works
- Step 1: Download the prebuilt Excel template containing Eaglerise Electric & Electronic's (002922SZ) data.
- Step 2: Review the pre-filled sheets to familiarize yourself with the key performance metrics.
- Step 3: Modify forecasts and assumptions in the editable yellow cells (WACC, growth rate, and margins).
- Step 4: Instantly access the recalculated results, which include Eaglerise's intrinsic value.
- Step 5: Use the outputs to make informed investment decisions or create comprehensive reports.
Why Choose This Calculator for Eaglerise Electric & Electronic (002922SZ)?
- All-in-One Solution: Features DCF, WACC, and financial ratio analyses seamlessly integrated.
- Flexible Customization: Easily modify yellow-highlighted fields to explore different scenarios.
- In-Depth Analysis: Instantly computes Eaglerise’s intrinsic value and Net Present Value.
- Data-Rich Environment: Comes with historical and projected data for precise calculations.
- High Standards: Perfect for financial analysts, investors, and consultants in the industry.
Who Can Benefit from Eaglerise Electric & Electronic (China) Co., Ltd (002922SZ)?
- Investors: Make informed choices with a high-quality valuation tool tailored for your needs.
- Financial Analysts: Streamline your workflow with an easily customizable DCF model that’s ready to go.
- Consultants: Efficiently modify the template to create impactful client presentations or reports.
- Finance Enthusiasts: Enhance your knowledge of valuation methods through practical, real-world case studies.
- Educators and Students: Utilize it as a hands-on educational resource for finance courses.
Contents of the Template
- Operating and Balance Sheet Data: Pre-filled historical data and forecasts for Eaglerise Electric & Electronic (China) Co., Ltd (002922SZ), including revenue, EBITDA, EBIT, and capital expenditures.
- WACC Calculation: A dedicated sheet for calculating the Weighted Average Cost of Capital (WACC), featuring parameters such as Beta, risk-free rate, and share price.
- DCF Valuation (Unlevered and Levered): Customizable Discounted Cash Flow models that present intrinsic value along with comprehensive calculations.
- Financial Statements: Pre-loaded annual and quarterly financial statements to facilitate thorough analysis.
- Key Ratios: Includes profitability, leverage, and efficiency ratios specific to Eaglerise Electric & Electronic (China) Co., Ltd (002922SZ).
- Dashboard and Charts: A visual overview of valuation outputs and assumptions, making it easy to analyze results.
Disclaimer
All information, articles, and product details provided on this website are for general informational and educational purposes only. We do not claim any ownership over, nor do we intend to infringe upon, any trademarks, copyrights, logos, brand names, or other intellectual property mentioned or depicted on this site. Such intellectual property remains the property of its respective owners, and any references here are made solely for identification or informational purposes, without implying any affiliation, endorsement, or partnership.
We make no representations or warranties, express or implied, regarding the accuracy, completeness, or suitability of any content or products presented. Nothing on this website should be construed as legal, tax, investment, financial, medical, or other professional advice. In addition, no part of this site—including articles or product references—constitutes a solicitation, recommendation, endorsement, advertisement, or offer to buy or sell any securities, franchises, or other financial instruments, particularly in jurisdictions where such activity would be unlawful.
All content is of a general nature and may not address the specific circumstances of any individual or entity. It is not a substitute for professional advice or services. Any actions you take based on the information provided here are strictly at your own risk. You accept full responsibility for any decisions or outcomes arising from your use of this website and agree to release us from any liability in connection with your use of, or reliance upon, the content or products found herein.