
|
Suzhou Hengmingda Electronic Technology Co., Ltd. (002947.sz) DCF -Bewertung |
Fully Editable: Tailor To Your Needs In Excel Or Sheets
Professional Design: Trusted, Industry-Standard Templates
Investor-Approved Valuation Models
MAC/PC Compatible, Fully Unlocked
No Expertise Is Needed; Easy To Follow
Suzhou Hengmingda Electronic Technology Co., Ltd. (002947.SZ) Bundle
Stärken Sie Ihre Anlagestrategien mit dem DCF -Taschenrechner (002947SZ)! Erforschen Sie authentische Finanzdaten von Suzhou Hengmingda Electronic Technology Co., Ltd., stellen Sie Wachstumsprojektionen und -kosten an und beachten Sie sofort, wie sich diese Modifikationen auf den inneren Wert von (002947SZ) auswirken.
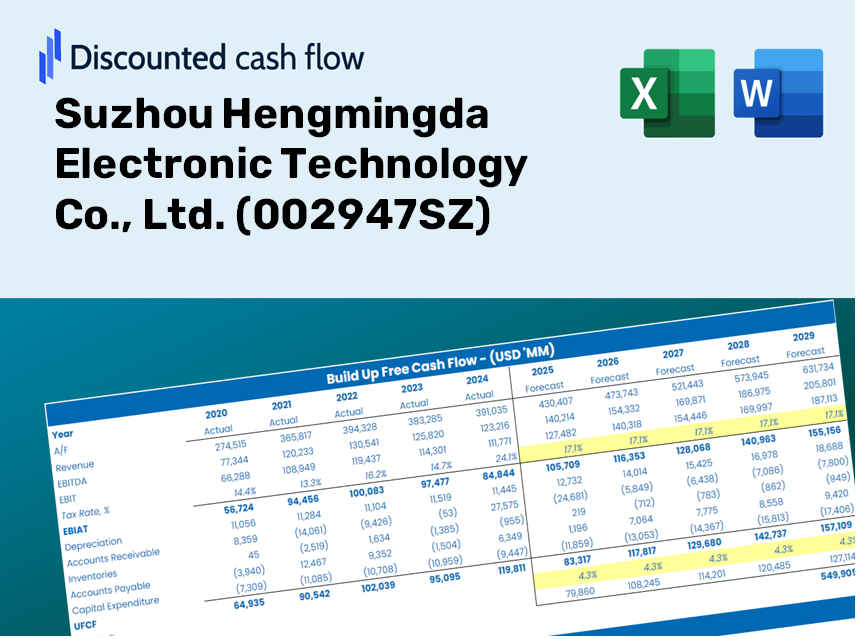
Discounted Cash Flow (DCF) - (USD MM)
| Year | AY1 2020 |
AY2 2021 |
AY3 2022 |
AY4 2023 |
AY5 2024 |
FY1 2025 |
FY2 2026 |
FY3 2027 |
FY4 2028 |
FY5 2029 |
|---|---|---|---|---|---|---|---|---|---|---|
| Revenue | 643.6 | 1,130.2 | 1,547.8 | 1,818.3 | 2,486.2 | 3,522.7 | 4,991.3 | 7,072.1 | 10,020.4 | 14,197.8 |
| Revenue Growth, % | 0 | 75.59 | 36.95 | 17.48 | 36.74 | 41.69 | 41.69 | 41.69 | 41.69 | 41.69 |
| EBITDA | 121.6 | 54.7 | 205.7 | 335.1 | 512.1 | 535.8 | 759.1 | 1,075.6 | 1,524.0 | 2,159.3 |
| EBITDA, % | 18.89 | 4.84 | 13.29 | 18.43 | 20.6 | 15.21 | 15.21 | 15.21 | 15.21 | 15.21 |
| Depreciation | 17.3 | 24.7 | 31.9 | 38.9 | 51.3 | 78.5 | 111.2 | 157.6 | 223.3 | 316.4 |
| Depreciation, % | 2.69 | 2.18 | 2.06 | 2.14 | 2.06 | 2.23 | 2.23 | 2.23 | 2.23 | 2.23 |
| EBIT | 104.3 | 30.0 | 173.8 | 296.2 | 460.7 | 457.3 | 647.9 | 918.0 | 1,300.7 | 1,842.9 |
| EBIT, % | 16.2 | 2.65 | 11.23 | 16.29 | 18.53 | 12.98 | 12.98 | 12.98 | 12.98 | 12.98 |
| Total Cash | 362.4 | 410.7 | 572.5 | 909.9 | 1,684.8 | 1,743.3 | 2,470.1 | 3,499.8 | 4,958.9 | 7,026.2 |
| Total Cash, percent | .0 | .0 | .0 | .0 | .0 | .0 | .0 | .0 | .0 | .0 |
| Account Receivables | 328.3 | .0 | 757.3 | 944.5 | 1,244.0 | 1,422.6 | 2,015.6 | 2,856.0 | 4,046.6 | 5,733.6 |
| Account Receivables, % | 51.01 | 0 | 48.93 | 51.95 | 50.03 | 40.38 | 40.38 | 40.38 | 40.38 | 40.38 |
| Inventories | 94.4 | 207.5 | 288.4 | 209.9 | 269.8 | 521.7 | 739.2 | 1,047.4 | 1,484.0 | 2,102.7 |
| Inventories, % | 14.67 | 18.36 | 18.63 | 11.54 | 10.85 | 14.81 | 14.81 | 14.81 | 14.81 | 14.81 |
| Accounts Payable | 199.5 | 394.9 | 418.0 | 474.4 | 528.9 | 988.5 | 1,400.7 | 1,984.6 | 2,811.9 | 3,984.2 |
| Accounts Payable, % | 31 | 34.94 | 27.01 | 26.09 | 21.27 | 28.06 | 28.06 | 28.06 | 28.06 | 28.06 |
| Capital Expenditure | -71.5 | -181.1 | -112.3 | -216.5 | -97.2 | -353.7 | -501.1 | -710.1 | -1,006.1 | -1,425.5 |
| Capital Expenditure, % | -11.11 | -16.02 | -7.25 | -11.9 | -3.91 | -10.04 | -10.04 | -10.04 | -10.04 | -10.04 |
| Tax Rate, % | 12.69 | 12.69 | 12.69 | 12.69 | 12.69 | 12.69 | 12.69 | 12.69 | 12.69 | 12.69 |
| EBITAT | 90.0 | 21.6 | 146.3 | 260.6 | 402.2 | 382.2 | 541.6 | 767.4 | 1,087.3 | 1,540.6 |
| Depreciation | ||||||||||
| Changes in Account Receivables | ||||||||||
| Changes in Inventories | ||||||||||
| Changes in Accounts Payable | ||||||||||
| Capital Expenditure | ||||||||||
| UFCF | -187.3 | 275.8 | -749.1 | 30.7 | 51.5 | 136.2 | -246.8 | -349.6 | -495.4 | -701.9 |
| WACC, % | 4.7 | 4.7 | 4.7 | 4.7 | 4.7 | 4.7 | 4.7 | 4.7 | 4.7 | 4.7 |
| PV UFCF | ||||||||||
| SUM PV UFCF | -1,369.8 | |||||||||
| Long Term Growth Rate, % | 2.00 | |||||||||
| Free cash flow (T + 1) | -716 | |||||||||
| Terminal Value | -26,508 | |||||||||
| Present Terminal Value | -21,068 | |||||||||
| Enterprise Value | -22,438 | |||||||||
| Net Debt | -472 | |||||||||
| Equity Value | -21,966 | |||||||||
| Diluted Shares Outstanding, MM | 239 | |||||||||
| Equity Value Per Share | -91.84 |
Your Benefits
- Comprehensive Financial Model: Leveraging Suzhou Hengmingda's actual data for accurate DCF valuation.
- Complete Forecast Management: Modify revenue growth, profit margins, WACC, and other essential variables.
- Real-Time Calculations: Automatic updates let you view results instantly as adjustments are made.
- Professional-Grade Template: A polished Excel file specifically crafted for high-level valuation.
- Flexible and Reusable: Designed for adaptability, enabling repeated application for in-depth forecasts.
Core Characteristics
- Customizable Financial Assumptions: Adjust key parameters such as revenue growth, EBITDA margin, and capital expenditures to fit your analysis.
- Instant DCF Valuation: Quickly computes intrinsic value, NPV, and additional metrics with ease.
- Industry-Standard Precision: Incorporates Suzhou Hengmingda's real financial data for reliable valuation results.
- Simplified Scenario Analysis: Effortlessly experiment with various assumptions and evaluate different outcomes.
- Efficiency Booster: Streamlines the valuation process, removing the need to construct intricate models from the ground up.
How It Works
- Step 1: Download the Excel file.
- Step 2: Review the pre-filled Suzhou Hengmingda data (historical and projected).
- Step 3: Modify key assumptions (highlighted in yellow) based on your analysis.
- Step 4: Observe the automatic recalculations for Suzhou Hengmingda's intrinsic value.
- Step 5: Utilize the results for investment decisions or reporting.
Why Select Suzhou Hengmingda Electronic Technology Co., Ltd. (002947SZ)?
- Time Efficient: Skip the hassle of building a financial model from the ground up – our tools are ready for immediate use.
- Enhanced Precision: Dependable financial data and methodologies minimize valuation errors.
- Completely Customizable: Adjust the model to align with your specific assumptions and forecasts.
- User-Friendly: Intuitive charts and outputs simplify data interpretation and analysis.
- Expert Endorsement: Crafted for industry professionals who prioritize accuracy and ease of use.
Who Can Benefit from Our Services?
- Engineering Students: Gain practical experience by working on real electronic technology projects.
- Researchers: Utilize our innovative models for your studies in electronics and technology.
- Investors: Evaluate your investment strategies by examining the performance of Suzhou Hengmingda (002947SZ).
- Industry Analysts: Optimize your analysis process with our customizable tech evaluation tools.
- Startup Founders: Learn from how established companies like ours navigate the technology landscape.
Contents of the Template
- Comprehensive DCF Model: An editable template featuring in-depth valuation calculations.
- Real-World Data: Suzhou Hengmingda Electronic Technology Co., Ltd.'s (002947SZ) historical and projected financials preloaded for analysis.
- Customizable Parameters: Modify WACC, growth rates, and tax assumptions to explore various scenarios.
- Financial Statements: Complete annual and quarterly reports for enhanced insights.
- Key Ratios: Integrated analysis for assessing profitability, efficiency, and leverage.
- Dashboard with Visual Outputs: Visuals and tables to provide clear, actionable insights.
Disclaimer
All information, articles, and product details provided on this website are for general informational and educational purposes only. We do not claim any ownership over, nor do we intend to infringe upon, any trademarks, copyrights, logos, brand names, or other intellectual property mentioned or depicted on this site. Such intellectual property remains the property of its respective owners, and any references here are made solely for identification or informational purposes, without implying any affiliation, endorsement, or partnership.
We make no representations or warranties, express or implied, regarding the accuracy, completeness, or suitability of any content or products presented. Nothing on this website should be construed as legal, tax, investment, financial, medical, or other professional advice. In addition, no part of this site—including articles or product references—constitutes a solicitation, recommendation, endorsement, advertisement, or offer to buy or sell any securities, franchises, or other financial instruments, particularly in jurisdictions where such activity would be unlawful.
All content is of a general nature and may not address the specific circumstances of any individual or entity. It is not a substitute for professional advice or services. Any actions you take based on the information provided here are strictly at your own risk. You accept full responsibility for any decisions or outcomes arising from your use of this website and agree to release us from any liability in connection with your use of, or reliance upon, the content or products found herein.