
|
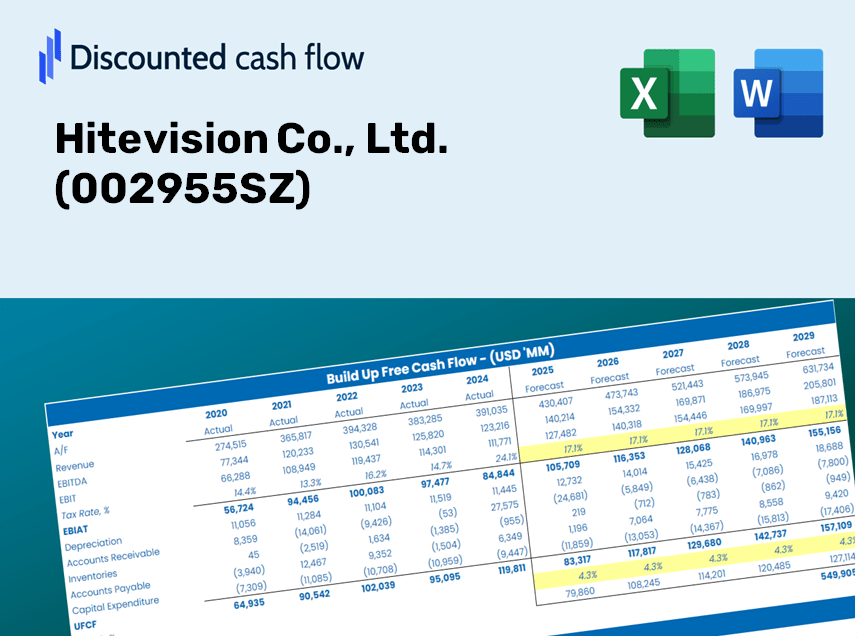
Hitevision Co., Ltd. (002955.sz) DCF -Bewertung |
Fully Editable: Tailor To Your Needs In Excel Or Sheets
Professional Design: Trusted, Industry-Standard Templates
Investor-Approved Valuation Models
MAC/PC Compatible, Fully Unlocked
No Expertise Is Needed; Easy To Follow
Hitevision Co., Ltd. (002955.SZ) Bundle
Entdecken Sie die finanzielle Zukunft von Hitevision Co., Ltd. (002955SZ) mit unserem benutzerfreundlichen DCF-Taschenrechner! Geben Sie Ihre Projektionen für Wachstum, Margen und Kosten ein, um den inneren Wert von Hitevision Co., Ltd. (002955SZ) zu berechnen und Ihre Anlagestrategie zu verbessern.
Discounted Cash Flow (DCF) - (USD MM)
| Year | AY1 2020 |
AY2 2021 |
AY3 2022 |
AY4 2023 |
AY5 2024 |
FY1 2025 |
FY2 2026 |
FY3 2027 |
FY4 2028 |
FY5 2029 |
|---|---|---|---|---|---|---|---|---|---|---|
| Revenue | 3,993.6 | 5,811.4 | 4,549.5 | 3,929.5 | 3,525.2 | 3,524.2 | 3,523.2 | 3,522.2 | 3,521.2 | 3,520.2 |
| Revenue Growth, % | 0 | 45.52 | -21.71 | -13.63 | -10.29 | -0.02849762 | -0.02849762 | -0.02849762 | -0.02849762 | -0.02849762 |
| EBITDA | 158.9 | 314.5 | 590.5 | 559.7 | 407.1 | 339.5 | 339.4 | 339.3 | 339.2 | 339.1 |
| EBITDA, % | 3.98 | 5.41 | 12.98 | 14.24 | 11.55 | 9.63 | 9.63 | 9.63 | 9.63 | 9.63 |
| Depreciation | 63.9 | 100.2 | 106.4 | 92.4 | 95.3 | 75.5 | 75.5 | 75.5 | 75.5 | 75.5 |
| Depreciation, % | 1.6 | 1.72 | 2.34 | 2.35 | 2.7 | 2.14 | 2.14 | 2.14 | 2.14 | 2.14 |
| EBIT | 95.0 | 214.3 | 484.1 | 467.3 | 311.8 | 263.9 | 263.8 | 263.8 | 263.7 | 263.6 |
| EBIT, % | 2.38 | 3.69 | 10.64 | 11.89 | 8.84 | 7.49 | 7.49 | 7.49 | 7.49 | 7.49 |
| Total Cash | 1,934.2 | 1,704.4 | 1,848.7 | 2,094.3 | 2,194.4 | 1,648.9 | 1,648.4 | 1,648.0 | 1,647.5 | 1,647.0 |
| Total Cash, percent | .0 | .0 | .0 | .0 | .0 | .0 | .0 | .0 | .0 | .0 |
| Account Receivables | 622.9 | 800.3 | 466.6 | 429.5 | 403.5 | 437.0 | 436.9 | 436.8 | 436.6 | 436.5 |
| Account Receivables, % | 15.6 | 13.77 | 10.26 | 10.93 | 11.45 | 12.4 | 12.4 | 12.4 | 12.4 | 12.4 |
| Inventories | 740.8 | 848.3 | 776.0 | 602.0 | 778.0 | 617.4 | 617.2 | 617.1 | 616.9 | 616.7 |
| Inventories, % | 18.55 | 14.6 | 17.06 | 15.32 | 22.07 | 17.52 | 17.52 | 17.52 | 17.52 | 17.52 |
| Accounts Payable | 765.5 | 1,040.7 | 473.7 | 514.2 | 577.5 | 542.4 | 542.2 | 542.1 | 541.9 | 541.8 |
| Accounts Payable, % | 19.17 | 17.91 | 10.41 | 13.09 | 16.38 | 15.39 | 15.39 | 15.39 | 15.39 | 15.39 |
| Capital Expenditure | -355.9 | -230.1 | -155.7 | -95.5 | -47.1 | -141.4 | -141.3 | -141.3 | -141.2 | -141.2 |
| Capital Expenditure, % | -8.91 | -3.96 | -3.42 | -2.43 | -1.34 | -4.01 | -4.01 | -4.01 | -4.01 | -4.01 |
| Tax Rate, % | 25.25 | 25.25 | 25.25 | 25.25 | 25.25 | 25.25 | 25.25 | 25.25 | 25.25 | 25.25 |
| EBITAT | 61.5 | 157.6 | 386.2 | 328.5 | 233.1 | 191.7 | 191.6 | 191.6 | 191.5 | 191.5 |
| Depreciation | ||||||||||
| Changes in Account Receivables | ||||||||||
| Changes in Inventories | ||||||||||
| Changes in Accounts Payable | ||||||||||
| Capital Expenditure | ||||||||||
| UFCF | -828.6 | 18.1 | 175.9 | 577.0 | 194.6 | 217.9 | 126.0 | 126.0 | 125.9 | 125.9 |
| WACC, % | 4.59 | 4.61 | 4.63 | 4.61 | 4.62 | 4.61 | 4.61 | 4.61 | 4.61 | 4.61 |
| PV UFCF | ||||||||||
| SUM PV UFCF | 639.1 | |||||||||
| Long Term Growth Rate, % | 3.50 | |||||||||
| Free cash flow (T + 1) | 130 | |||||||||
| Terminal Value | 11,722 | |||||||||
| Present Terminal Value | 9,357 | |||||||||
| Enterprise Value | 9,996 | |||||||||
| Net Debt | -1,579 | |||||||||
| Equity Value | 11,575 | |||||||||
| Diluted Shares Outstanding, MM | 236 | |||||||||
| Equity Value Per Share | 49.03 |
What You Will Receive
- Authentic Hitevision Financial Data: Comes pre-loaded with Hitevision’s historical and forecasted financial metrics for accurate analysis.
- Customizable Template: Easily adjust essential inputs such as revenue growth, WACC, and EBITDA percentage.
- Instant Calculations: Watch Hitevision’s intrinsic value update in real-time as you make adjustments.
- Expert Valuation Tool: Tailored for investors, analysts, and consultants who demand precise DCF evaluations.
- Intuitive User Interface: Straightforward layout and clear guidelines suitable for all skill levels.
Core Highlights
- Authentic Hitevision Financials: Gain access to precise pre-loaded historical data along with future forecasts.
- Adjustable Forecast Parameters: Modify the yellow-highlighted fields such as WACC, growth rates, and profit margins.
- Real-Time Calculations: Automatic adjustments for DCF, Net Present Value (NPV), and cash flow assessments.
- User-Friendly Dashboard: Clear and informative charts and summaries to illustrate your valuation outcomes.
- Designed for All Skill Levels: An easy-to-navigate layout tailored for investors, CFOs, and consultants alike.
How It Works
- Download: Get the pre-configured Excel file containing Hitevision Co., Ltd.'s (002955SZ) financial information.
- Customize: Tailor your forecasts, including growth rates, EBITDA percentages, and WACC values.
- Update Automatically: Enjoy real-time updates for intrinsic value and NPV calculations.
- Test Scenarios: Generate various projections and instantly compare the results.
- Make Decisions: Leverage the valuation insights to inform your investment strategy.
Why Choose Hitevision Co., Ltd. (002955SZ)?
- Save Time: Skip the hassle of building complex financial models – our tools are user-ready.
- Enhance Accuracy: Our dependable financial metrics and formulas minimize valuation errors.
- Completely Customizable: Adjust the model to fit your specific assumptions and forecasts.
- Easy to Understand: Intuitive charts and outputs simplify data interpretation.
- Endorsed by Professionals: Crafted for industry experts who prioritize precision and ease of use.
Who Can Benefit from Hitevision Co., Ltd. (002955SZ)?
- Investors: Enhance your investment strategies with a top-tier valuation tool.
- Financial Analysts: Streamline your work with a customizable DCF model readily available.
- Consultants: Effortlessly modify the template for impactful client presentations and reports.
- Finance Enthusiasts: Expand your knowledge of valuation methods through practical examples.
- Educators and Students: Utilize it as an effective resource in finance-related academic programs.
Contents of the Template
- Pre-Filled DCF Model: Hitevision Co., Ltd.'s (002955SZ) financial data preloaded for immediate analysis.
- WACC Calculator: Comprehensive calculations for Weighted Average Cost of Capital.
- Financial Ratios: Assess Hitevision's (002955SZ) profitability, leverage, and efficiency metrics.
- Editable Inputs: Adjust assumptions such as growth rates, margins, and CAPEX to align with your scenarios.
- Financial Statements: Annual and quarterly reports to facilitate in-depth analysis.
- Interactive Dashboard: Effortlessly visualize key valuation metrics and outcomes.
Disclaimer
All information, articles, and product details provided on this website are for general informational and educational purposes only. We do not claim any ownership over, nor do we intend to infringe upon, any trademarks, copyrights, logos, brand names, or other intellectual property mentioned or depicted on this site. Such intellectual property remains the property of its respective owners, and any references here are made solely for identification or informational purposes, without implying any affiliation, endorsement, or partnership.
We make no representations or warranties, express or implied, regarding the accuracy, completeness, or suitability of any content or products presented. Nothing on this website should be construed as legal, tax, investment, financial, medical, or other professional advice. In addition, no part of this site—including articles or product references—constitutes a solicitation, recommendation, endorsement, advertisement, or offer to buy or sell any securities, franchises, or other financial instruments, particularly in jurisdictions where such activity would be unlawful.
All content is of a general nature and may not address the specific circumstances of any individual or entity. It is not a substitute for professional advice or services. Any actions you take based on the information provided here are strictly at your own risk. You accept full responsibility for any decisions or outcomes arising from your use of this website and agree to release us from any liability in connection with your use of, or reliance upon, the content or products found herein.