
|
Lucky Harvest Co., Ltd. (002965.SZ) DCF -Bewertung |
Fully Editable: Tailor To Your Needs In Excel Or Sheets
Professional Design: Trusted, Industry-Standard Templates
Investor-Approved Valuation Models
MAC/PC Compatible, Fully Unlocked
No Expertise Is Needed; Easy To Follow
Lucky Harvest Co., Ltd. (002965.SZ) Bundle
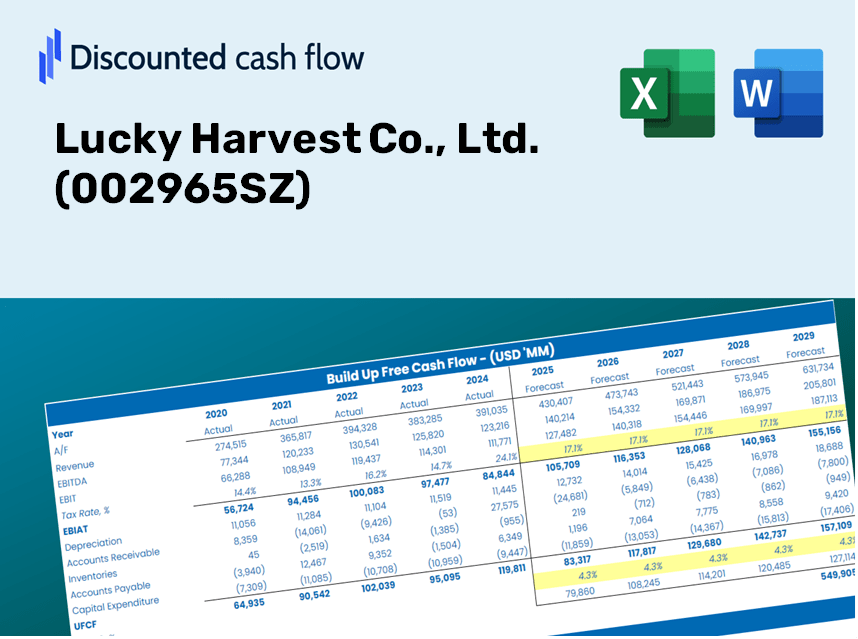
Gewinnen Sie Einblicke in Ihre Lucky Harvest Co., Ltd. (002965SZ) Bewertungsanalyse unter Verwendung unseres hochmodernen DCF-Taschenrechners! Diese Excel -Vorlage ist mit realen (002965SZ) Daten vorinstalliert, sodass Sie Prognosen und Annahmen anpassen können, um den inneren Wert von Lucky Harvest Co., Ltd., genau zu bestimmen.
Discounted Cash Flow (DCF) - (USD MM)
| Year | AY1 2020 |
AY2 2021 |
AY3 2022 |
AY4 2023 |
AY5 2024 |
FY1 2025 |
FY2 2026 |
FY3 2027 |
FY4 2028 |
FY5 2029 |
|---|---|---|---|---|---|---|---|---|---|---|
| Revenue | 1,839.4 | 2,370.8 | 4,289.5 | 5,703.2 | 6,744.2 | 9,459.3 | 13,267.5 | 18,608.7 | 26,100.2 | 36,607.6 |
| Revenue Growth, % | 0 | 28.89 | 80.93 | 32.96 | 18.25 | 40.26 | 40.26 | 40.26 | 40.26 | 40.26 |
| EBITDA | 220.5 | 148.3 | 348.4 | 548.3 | 501.6 | 821.4 | 1,152.0 | 1,615.8 | 2,266.3 | 3,178.7 |
| EBITDA, % | 11.99 | 6.26 | 8.12 | 9.61 | 7.44 | 8.68 | 8.68 | 8.68 | 8.68 | 8.68 |
| Depreciation | 48.1 | 57.5 | 66.8 | 87.5 | 116.4 | 186.5 | 261.6 | 366.9 | 514.6 | 721.7 |
| Depreciation, % | 2.62 | 2.42 | 1.56 | 1.53 | 1.73 | 1.97 | 1.97 | 1.97 | 1.97 | 1.97 |
| EBIT | 172.4 | 90.8 | 281.6 | 460.8 | 385.2 | 634.9 | 890.5 | 1,248.9 | 1,751.7 | 2,457.0 |
| EBIT, % | 9.37 | 3.83 | 6.56 | 8.08 | 5.71 | 6.71 | 6.71 | 6.71 | 6.71 | 6.71 |
| Total Cash | 1,399.6 | 1,083.7 | 801.2 | 807.6 | 1,648.1 | 3,388.0 | 4,751.9 | 6,665.0 | 9,348.1 | 13,111.5 |
| Total Cash, percent | .0 | .0 | .0 | .0 | .0 | .0 | .0 | .0 | .0 | .0 |
| Account Receivables | 662.1 | 892.3 | 1,747.8 | 2,165.5 | 1,993.5 | 3,441.5 | 4,826.9 | 6,770.2 | 9,495.7 | 13,318.5 |
| Account Receivables, % | 36 | 37.64 | 40.75 | 37.97 | 29.56 | 36.38 | 36.38 | 36.38 | 36.38 | 36.38 |
| Inventories | 518.7 | 805.9 | 1,241.3 | 1,569.7 | 1,896.4 | 2,776.8 | 3,894.7 | 5,462.6 | 7,661.7 | 10,746.2 |
| Inventories, % | 28.2 | 33.99 | 28.94 | 27.52 | 28.12 | 29.36 | 29.36 | 29.36 | 29.36 | 29.36 |
| Accounts Payable | 787.4 | 1,059.6 | 2,136.5 | 2,697.5 | 3,002.2 | 4,334.7 | 6,079.8 | 8,527.4 | 11,960.4 | 16,775.4 |
| Accounts Payable, % | 42.81 | 44.69 | 49.81 | 47.3 | 44.51 | 45.82 | 45.82 | 45.82 | 45.82 | 45.82 |
| Capital Expenditure | -89.1 | -282.4 | -373.1 | -239.8 | -212.3 | -620.6 | -870.4 | -1,220.9 | -1,712.3 | -2,401.7 |
| Capital Expenditure, % | -4.84 | -11.91 | -8.7 | -4.21 | -3.15 | -6.56 | -6.56 | -6.56 | -6.56 | -6.56 |
| Tax Rate, % | 10.18 | 10.18 | 10.18 | 10.18 | 10.18 | 10.18 | 10.18 | 10.18 | 10.18 | 10.18 |
| EBITAT | 146.8 | 86.2 | 260.1 | 409.1 | 345.9 | 572.6 | 803.1 | 1,126.5 | 1,579.9 | 2,216.0 |
| Depreciation | ||||||||||
| Changes in Account Receivables | ||||||||||
| Changes in Inventories | ||||||||||
| Changes in Accounts Payable | ||||||||||
| Capital Expenditure | ||||||||||
| UFCF | -287.6 | -383.8 | -260.2 | 71.7 | 399.9 | -857.2 | -564.0 | -791.1 | -1,109.5 | -1,556.2 |
| WACC, % | 4.57 | 4.59 | 4.58 | 4.58 | 4.58 | 4.58 | 4.58 | 4.58 | 4.58 | 4.58 |
| PV UFCF | ||||||||||
| SUM PV UFCF | -4,198.4 | |||||||||
| Long Term Growth Rate, % | 3.50 | |||||||||
| Free cash flow (T + 1) | -1,611 | |||||||||
| Terminal Value | -149,009 | |||||||||
| Present Terminal Value | -119,110 | |||||||||
| Enterprise Value | -123,309 | |||||||||
| Net Debt | -730 | |||||||||
| Equity Value | -122,579 | |||||||||
| Diluted Shares Outstanding, MM | 212 | |||||||||
| Equity Value Per Share | -578.28 |
Benefits You'll Receive
- Authentic Lucky Harvest Financials: Access historical and projected data for precise assessments.
- Customizable Parameters: Tailor WACC, tax rates, revenue growth, and capital expenditure inputs.
- Real-Time Calculations: Dynamic computation of intrinsic value and NPV.
- Scenario Testing: Evaluate various scenarios to analyze Lucky Harvest's potential performance.
- User-Friendly Interface: Designed for industry professionals while remaining approachable for newcomers.
Key Features
- Pre-Loaded Data: Lucky Harvest Co., Ltd.'s historical financial statements and pre-filled forecasts.
- Fully Adjustable Inputs: Customize WACC, tax rates, revenue growth, and EBITDA margins.
- Instant Results: Observe Lucky Harvest's intrinsic value recalculating in real time.
- Clear Visual Outputs: Dashboard charts illustrate valuation results and key metrics.
- Built for Accuracy: A professional tool designed for analysts, investors, and finance professionals.
How It Works
- Download the Template: Gain immediate access to the Excel-based Lucky Harvest Co., Ltd. (002965SZ) DCF Calculator.
- Input Your Assumptions: Modify the yellow-highlighted cells to set your growth rates, WACC, margins, and other variables.
- Instant Calculations: The model will automatically compute the intrinsic value of Lucky Harvest Co., Ltd. (002965SZ).
- Test Scenarios: Experiment with different assumptions to see how they impact valuation outcomes.
- Analyze and Decide: Utilize the results to inform your investment strategies or financial evaluations.
Why Opt for Lucky Harvest Co., Ltd. (002965SZ)?
- User-Friendly Design: Crafted for both novices and seasoned professionals.
- Customizable Inputs: Adjust parameters effortlessly to align with your analysis.
- Real-Time Adjustments: Instantly observe changes in Lucky Harvest's valuation as you modify inputs.
- Pre-Loaded Data: Features actual financial information from Lucky Harvest for swift evaluations.
- Preferred by Experts: Trusted by investors and analysts for making strategic choices.
Who Can Benefit from Lucky Harvest Co., Ltd. (002965SZ)?
- Investors: Make informed investment decisions by accurately assessing the fair value of Lucky Harvest Co., Ltd. (002965SZ).
- CFOs: Utilize a high-quality DCF model for comprehensive financial reporting and analysis.
- Consultants: Efficiently modify the template for client valuation reports related to Lucky Harvest Co., Ltd. (002965SZ).
- Entrepreneurs: Acquire valuable insights into the financial modeling practices of leading companies.
- Educators: Employ this resource as an educational tool to illustrate various valuation methodologies.
Contents of the Template
- In-Depth DCF Model: Editable framework featuring comprehensive valuation calculations.
- Actual Financial Data: Lucky Harvest Co., Ltd.'s (002965SZ) historical and forecasted financials are preloaded for evaluation.
- Adjustable Variables: Modify WACC, growth rates, and tax assumptions to explore different scenarios.
- Comprehensive Financial Statements: Detailed annual and quarterly reports for enhanced analysis.
- Essential Ratios: Integrated assessments for profitability, efficiency, and financial leverage.
- Interactive Dashboard with Visual Outputs: Graphs and tables that provide clear, actionable insights.
Disclaimer
All information, articles, and product details provided on this website are for general informational and educational purposes only. We do not claim any ownership over, nor do we intend to infringe upon, any trademarks, copyrights, logos, brand names, or other intellectual property mentioned or depicted on this site. Such intellectual property remains the property of its respective owners, and any references here are made solely for identification or informational purposes, without implying any affiliation, endorsement, or partnership.
We make no representations or warranties, express or implied, regarding the accuracy, completeness, or suitability of any content or products presented. Nothing on this website should be construed as legal, tax, investment, financial, medical, or other professional advice. In addition, no part of this site—including articles or product references—constitutes a solicitation, recommendation, endorsement, advertisement, or offer to buy or sell any securities, franchises, or other financial instruments, particularly in jurisdictions where such activity would be unlawful.
All content is of a general nature and may not address the specific circumstances of any individual or entity. It is not a substitute for professional advice or services. Any actions you take based on the information provided here are strictly at your own risk. You accept full responsibility for any decisions or outcomes arising from your use of this website and agree to release us from any liability in connection with your use of, or reliance upon, the content or products found herein.