
|
Guang Zhou Grg Metrologie & Test Co., Ltd. (002967.sz) DCF -Bewertung |
Fully Editable: Tailor To Your Needs In Excel Or Sheets
Professional Design: Trusted, Industry-Standard Templates
Investor-Approved Valuation Models
MAC/PC Compatible, Fully Unlocked
No Expertise Is Needed; Easy To Follow
Guang Zhou GRG Metrology & Test Co., Ltd. (002967.SZ) Bundle
Ich möchte den inneren Wert der Metrologie von Guang Zhou Grg bewerten & Test Co., Ltd.? Unser (002967SZ) DCF-Taschenrechner integriert reale Daten mit umfangreichen Anpassungsfunktionen, sodass Sie Ihre Prognosen verfeinern und Ihre Anlagestrategien verbessern können.
Discounted Cash Flow (DCF) - (USD MM)
| Year | AY1 2020 |
AY2 2021 |
AY3 2022 |
AY4 2023 |
AY5 2024 |
FY1 2025 |
FY2 2026 |
FY3 2027 |
FY4 2028 |
FY5 2029 |
|---|---|---|---|---|---|---|---|---|---|---|
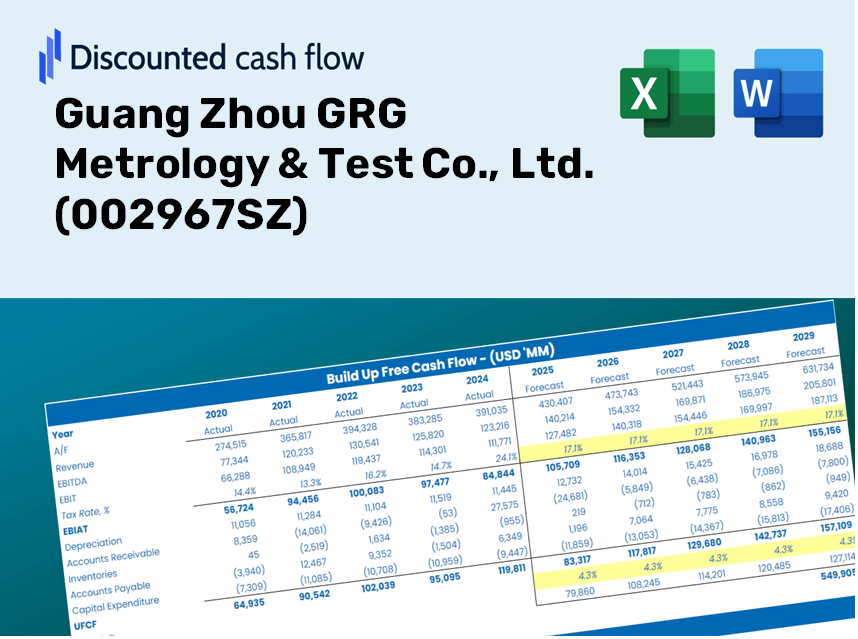
| Revenue | 1,840.4 | 2,247.0 | 2,604.1 | 2,888.9 | 3,206.8 | 3,687.3 | 4,239.7 | 4,874.9 | 5,605.2 | 6,444.9 |
| Revenue Growth, % | 0 | 22.09 | 15.89 | 10.94 | 11.01 | 14.98 | 14.98 | 14.98 | 14.98 | 14.98 |
| EBITDA | 448.8 | 564.0 | 522.2 | 558.8 | 715.7 | 820.1 | 942.9 | 1,084.2 | 1,246.6 | 1,433.4 |
| EBITDA, % | 24.39 | 25.1 | 20.05 | 19.34 | 22.32 | 22.24 | 22.24 | 22.24 | 22.24 | 22.24 |
| Depreciation | 229.3 | 342.2 | 320.6 | 295.7 | 309.5 | 441.7 | 507.8 | 583.9 | 671.4 | 772.0 |
| Depreciation, % | 12.46 | 15.23 | 12.31 | 10.24 | 9.65 | 11.98 | 11.98 | 11.98 | 11.98 | 11.98 |
| EBIT | 219.5 | 221.8 | 201.6 | 263.0 | 406.2 | 378.4 | 435.1 | 500.2 | 575.2 | 661.4 |
| EBIT, % | 11.93 | 9.87 | 7.74 | 9.1 | 12.67 | 10.26 | 10.26 | 10.26 | 10.26 | 10.26 |
| Total Cash | 322.9 | 1,570.6 | 1,304.3 | 1,459.7 | 1,055.0 | 1,629.5 | 1,873.6 | 2,154.3 | 2,477.0 | 2,848.1 |
| Total Cash, percent | .0 | .0 | .0 | .0 | .0 | .0 | .0 | .0 | .0 | .0 |
| Account Receivables | 1,146.0 | 1,292.9 | 1,530.7 | 1,641.0 | 1,933.7 | 2,180.6 | 2,507.3 | 2,883.0 | 3,314.9 | 3,811.5 |
| Account Receivables, % | 62.27 | 57.54 | 58.78 | 56.81 | 60.3 | 59.14 | 59.14 | 59.14 | 59.14 | 59.14 |
| Inventories | 5.1 | 14.8 | 23.2 | 39.8 | 30.9 | 30.7 | 35.3 | 40.6 | 46.7 | 53.7 |
| Inventories, % | 0.27747 | 0.65808 | 0.88944 | 1.38 | 0.96492 | 0.83373 | 0.83373 | 0.83373 | 0.83373 | 0.83373 |
| Accounts Payable | 51.7 | 374.6 | 415.0 | 401.2 | 511.2 | 481.2 | 553.2 | 636.1 | 731.4 | 841.0 |
| Accounts Payable, % | 2.81 | 16.67 | 15.94 | 13.89 | 15.94 | 13.05 | 13.05 | 13.05 | 13.05 | 13.05 |
| Capital Expenditure | -362.8 | -455.1 | -604.1 | -593.6 | -914.2 | -827.6 | -951.6 | -1,094.1 | -1,258.0 | -1,446.5 |
| Capital Expenditure, % | -19.71 | -20.25 | -23.2 | -20.55 | -28.51 | -22.44 | -22.44 | -22.44 | -22.44 | -22.44 |
| Tax Rate, % | 8.82 | 8.82 | 8.82 | 8.82 | 8.82 | 8.82 | 8.82 | 8.82 | 8.82 | 8.82 |
| EBITAT | 209.9 | 197.6 | 201.4 | 252.5 | 370.4 | 357.1 | 410.6 | 472.1 | 542.8 | 624.1 |
| Depreciation | ||||||||||
| Changes in Account Receivables | ||||||||||
| Changes in Inventories | ||||||||||
| Changes in Accounts Payable | ||||||||||
| Capital Expenditure | ||||||||||
| UFCF | -1,022.9 | 251.0 | -287.8 | -186.2 | -408.1 | -305.6 | -292.4 | -336.2 | -386.5 | -444.4 |
| WACC, % | 6.38 | 6.35 | 6.4 | 6.38 | 6.36 | 6.37 | 6.37 | 6.37 | 6.37 | 6.37 |
| PV UFCF | ||||||||||
| SUM PV UFCF | -1,453.1 | |||||||||
| Long Term Growth Rate, % | 4.00 | |||||||||
| Free cash flow (T + 1) | -462 | |||||||||
| Terminal Value | -19,468 | |||||||||
| Present Terminal Value | -14,294 | |||||||||
| Enterprise Value | -15,747 | |||||||||
| Net Debt | 630 | |||||||||
| Equity Value | -16,377 | |||||||||
| Diluted Shares Outstanding, MM | 577 | |||||||||
| Equity Value Per Share | -28.37 |
What You Will Gain
- Authentic GRG Data: Preloaded financial information – encompassing revenue to EBIT – derived from actual and projected metrics.
- Comprehensive Customization: Modify all key parameters (yellow cells) such as WACC, growth %, and tax rates.
- Real-Time Valuation Updates: Automatic recalculations to assess the effects of changes on GRG’s fair value.
- Flexible Excel Template: Designed for swift modifications, scenario analysis, and in-depth forecasts.
- Efficient and Precise: Avoid the hassle of building models from scratch while ensuring accuracy and adaptability.
Highlighted Features
- Comprehensive DCF Calculator: Offers in-depth unlevered and levered DCF valuation models tailored for Guang Zhou GRG Metrology & Test Co., Ltd. (002967SZ).
- WACC Calculator: Ready-to-use Weighted Average Cost of Capital sheet with adjustable inputs to fit your needs.
- Customizable Forecast Inputs: Easily alter growth rates, capital expenditures, and discount rates as per your analysis.
- Integrated Financial Ratios: Evaluate profitability, leverage, and efficiency ratios specifically for Guang Zhou GRG Metrology & Test Co., Ltd. (002967SZ).
- Interactive Dashboard and Charts: Visual representations that encapsulate essential valuation metrics for straightforward evaluation.
How It Functions
- 1. Access the Template: Download and open the Excel file containing Guang Zhou GRG Metrology & Test Co., Ltd.'s preloaded data.
- 2. Adjust Assumptions: Modify essential inputs such as growth rates, WACC, and capital expenditures.
- 3. Receive Immediate Results: The DCF model automatically calculates intrinsic value and NPV in real-time.
- 4. Explore Scenarios: Evaluate various forecasts to examine different valuation possibilities.
- 5. Present with Assurance: Share professional valuation insights to inform your decision-making process.
Why Choose Guang Zhou GRG Metrology & Test Co., Ltd. (002967SZ)?
- Time-Efficient: Skip the lengthy setup – our solutions are ready for immediate use.
- Enhanced Precision: Dependable data and algorithms minimize valuation errors.
- Completely Customizable: Adjust our tools to align with your specific insights and forecasts.
- User-Friendly Analysis: Intuitive charts and outputs simplify result interpretation.
- Endorsed by Industry Professionals: Crafted for those who prioritize accuracy and functionality.
Who Can Benefit from Our Solutions?
- Manufacturers: Ensure precision and quality in your production processes with our advanced metrology tools.
- Quality Control Specialists: Streamline inspections using our innovative testing equipment designed for efficiency.
- Research and Development Teams: Customize our solutions to meet specific testing requirements for new products.
- Engineering Professionals: Enhance your skills in measurement techniques using our user-friendly resources and support.
- Academic Institutions: Integrate our tools into your curriculum to provide students with hands-on experience in metrology.
What the Template Includes
- Preloaded GRG Metrology Data: Historical and projected financial information, encompassing revenue, EBIT, and capital expenditures.
- DCF and WACC Models: Advanced worksheets designed for calculating intrinsic value and Weighted Average Cost of Capital.
- Customizable Inputs: Cells highlighted in yellow for modifying revenue growth rates, tax percentages, and discount rates.
- Financial Statements: Detailed annual and quarterly financial reports for in-depth analysis.
- Key Ratios: Metrics including profitability, leverage, and efficiency ratios for performance assessment.
- Dashboard and Charts: Visual representations of valuation results and underlying assumptions.
Disclaimer
All information, articles, and product details provided on this website are for general informational and educational purposes only. We do not claim any ownership over, nor do we intend to infringe upon, any trademarks, copyrights, logos, brand names, or other intellectual property mentioned or depicted on this site. Such intellectual property remains the property of its respective owners, and any references here are made solely for identification or informational purposes, without implying any affiliation, endorsement, or partnership.
We make no representations or warranties, express or implied, regarding the accuracy, completeness, or suitability of any content or products presented. Nothing on this website should be construed as legal, tax, investment, financial, medical, or other professional advice. In addition, no part of this site—including articles or product references—constitutes a solicitation, recommendation, endorsement, advertisement, or offer to buy or sell any securities, franchises, or other financial instruments, particularly in jurisdictions where such activity would be unlawful.
All content is of a general nature and may not address the specific circumstances of any individual or entity. It is not a substitute for professional advice or services. Any actions you take based on the information provided here are strictly at your own risk. You accept full responsibility for any decisions or outcomes arising from your use of this website and agree to release us from any liability in connection with your use of, or reliance upon, the content or products found herein.