
|
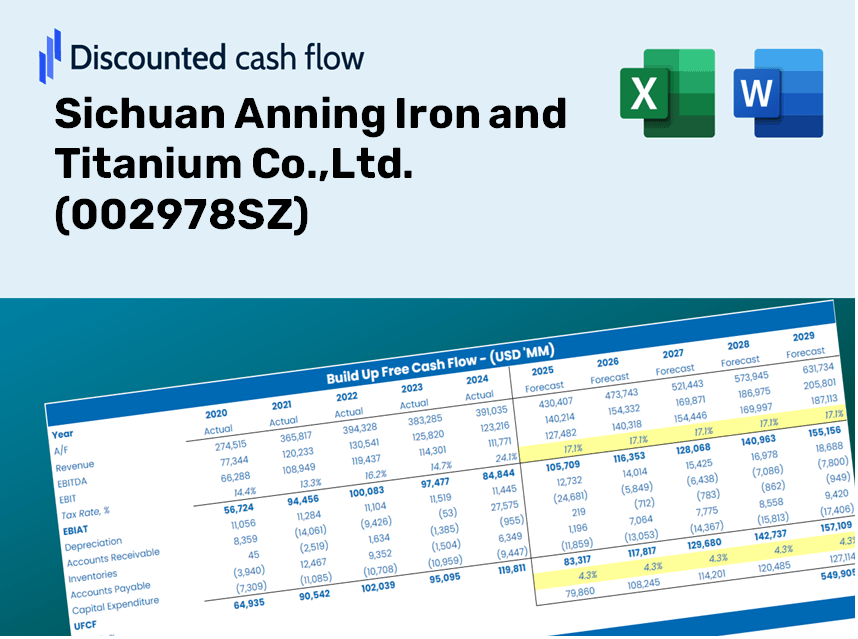
Sichuan Anning Iron und Titanium Co., Ltd. (002978.sz) DCF -Bewertung |
Fully Editable: Tailor To Your Needs In Excel Or Sheets
Professional Design: Trusted, Industry-Standard Templates
Investor-Approved Valuation Models
MAC/PC Compatible, Fully Unlocked
No Expertise Is Needed; Easy To Follow
Sichuan Anning Iron and Titanium Co.,Ltd. (002978.SZ) Bundle
Vereinfachen Sie Sichuan Anning Iron und Titanium Co., Ltd. Bewertung mit diesem anpassbaren DCF -Taschenrechner! Mit realer Sichuan Anning Iron und Titanium Co., Ltd. Financials und einstellbaren Prognoseeingaben können Sie Szenarien testen und den fairen Wert Sichuan Anning Iron und Titanium Co., Ltd. in Minuten aufdecken.
Discounted Cash Flow (DCF) - (USD MM)
| Year | AY1 2020 |
AY2 2021 |
AY3 2022 |
AY4 2023 |
AY5 2024 |
FY1 2025 |
FY2 2026 |
FY3 2027 |
FY4 2028 |
FY5 2029 |
|---|---|---|---|---|---|---|---|---|---|---|
| Revenue | 1,636.4 | 2,303.3 | 1,995.9 | 1,856.0 | 1,857.0 | 1,952.0 | 2,051.8 | 2,156.7 | 2,267.0 | 2,382.9 |
| Revenue Growth, % | 0 | 40.75 | -13.35 | -7.01 | 0.05553112 | 5.11 | 5.11 | 5.11 | 5.11 | 5.11 |
| EBITDA | 899.9 | 1,598.3 | 1,363.4 | 1,209.1 | 1,179.9 | 1,254.6 | 1,318.8 | 1,386.2 | 1,457.1 | 1,531.6 |
| EBITDA, % | 54.99 | 69.39 | 68.31 | 65.15 | 63.54 | 64.28 | 64.28 | 64.28 | 64.28 | 64.28 |
| Depreciation | 124.1 | 127.3 | 155.2 | 179.8 | 205.2 | 162.5 | 170.8 | 179.6 | 188.7 | 198.4 |
| Depreciation, % | 7.58 | 5.53 | 7.78 | 9.69 | 11.05 | 8.33 | 8.33 | 8.33 | 8.33 | 8.33 |
| EBIT | 775.8 | 1,471.0 | 1,208.2 | 1,029.3 | 974.7 | 1,092.1 | 1,148.0 | 1,206.7 | 1,268.4 | 1,333.2 |
| EBIT, % | 47.41 | 63.86 | 60.53 | 55.46 | 52.49 | 55.95 | 55.95 | 55.95 | 55.95 | 55.95 |
| Total Cash | 1,675.5 | 2,189.4 | 2,642.7 | 2,469.4 | 3,918.2 | 1,932.7 | 2,031.5 | 2,135.4 | 2,244.6 | 2,359.3 |
| Total Cash, percent | .0 | .0 | .0 | .0 | .0 | .0 | .0 | .0 | .0 | .0 |
| Account Receivables | 561.5 | 731.6 | 728.7 | 683.4 | 390.2 | 626.3 | 658.3 | 691.9 | 727.3 | 764.5 |
| Account Receivables, % | 34.31 | 31.76 | 36.51 | 36.82 | 21.01 | 32.08 | 32.08 | 32.08 | 32.08 | 32.08 |
| Inventories | 80.8 | 86.3 | 94.2 | 78.8 | 85.6 | 86.9 | 91.4 | 96.0 | 100.9 | 106.1 |
| Inventories, % | 4.94 | 3.75 | 4.72 | 4.25 | 4.61 | 4.45 | 4.45 | 4.45 | 4.45 | 4.45 |
| Accounts Payable | 294.0 | 221.5 | 166.3 | 308.6 | 103.9 | 227.0 | 238.6 | 250.8 | 263.6 | 277.1 |
| Accounts Payable, % | 17.97 | 9.62 | 8.33 | 16.63 | 5.59 | 11.63 | 11.63 | 11.63 | 11.63 | 11.63 |
| Capital Expenditure | -92.2 | -146.2 | -400.7 | -864.6 | -1,052.5 | -528.3 | -555.3 | -583.7 | -613.5 | -644.9 |
| Capital Expenditure, % | -5.63 | -6.35 | -20.07 | -46.58 | -56.67 | -27.06 | -27.06 | -27.06 | -27.06 | -27.06 |
| Tax Rate, % | 15.27 | 15.27 | 15.27 | 15.27 | 15.27 | 15.27 | 15.27 | 15.27 | 15.27 | 15.27 |
| EBITAT | 661.3 | 1,268.6 | 1,027.0 | 873.0 | 825.8 | 930.6 | 978.1 | 1,028.1 | 1,080.7 | 1,136.0 |
| Depreciation | ||||||||||
| Changes in Account Receivables | ||||||||||
| Changes in Inventories | ||||||||||
| Changes in Accounts Payable | ||||||||||
| Capital Expenditure | ||||||||||
| UFCF | 344.9 | 1,001.8 | 721.1 | 391.4 | 60.3 | 450.5 | 568.8 | 597.9 | 628.5 | 660.6 |
| WACC, % | 7.49 | 7.49 | 7.49 | 7.49 | 7.49 | 7.49 | 7.49 | 7.49 | 7.49 | 7.49 |
| PV UFCF | ||||||||||
| SUM PV UFCF | 2,323.9 | |||||||||
| Long Term Growth Rate, % | 2.00 | |||||||||
| Free cash flow (T + 1) | 674 | |||||||||
| Terminal Value | 12,269 | |||||||||
| Present Terminal Value | 8,549 | |||||||||
| Enterprise Value | 10,873 | |||||||||
| Net Debt | -3,403 | |||||||||
| Equity Value | 14,276 | |||||||||
| Diluted Shares Outstanding, MM | 400 | |||||||||
| Equity Value Per Share | 35.67 |
Benefits You Will Receive
- Authentic (002978SZ) Financial Data: Pre-loaded with Sichuan Anning Iron and Titanium's historical and projected figures for accurate analysis.
- Customizable Template: Easily adjust key inputs such as revenue growth, WACC, and EBITDA percentage.
- Instant Calculations: Witness the intrinsic value of (002978SZ) update in real-time as you make changes.
- Professional Valuation Tool: Tailored for investors, analysts, and consultants seeking reliable DCF results.
- Intuitive Design: Streamlined layout and straightforward instructions suitable for all skill levels.
Key Features
- Comprehensive DCF Calculator: Features detailed unlevered and levered DCF valuation models tailored for Sichuan Anning Iron and Titanium Co., Ltd. (002978SZ).
- WACC Calculator: Includes a pre-constructed Weighted Average Cost of Capital sheet with adjustable inputs specific to the company's needs.
- Customizable Forecast Assumptions: Easily adjust growth projections, capital expenditure plans, and discount rates.
- Integrated Financial Ratios: Evaluate profitability, leverage, and efficiency ratios relevant to Sichuan Anning Iron and Titanium Co., Ltd. (002978SZ).
- User-Friendly Dashboard and Charts: Visual representations to summarize critical valuation metrics for straightforward analysis.
How It Functions
- 1. Access the Template: Download and open the Excel file containing Sichuan Anning Iron and Titanium Co., Ltd.'s (002978SZ) preloaded data.
- 2. Modify Inputs: Adjust essential parameters such as growth projections, WACC, and capital expenditures.
- 3. View Outcomes in Real-Time: The DCF model automatically computes the intrinsic value and NPV.
- 4. Experiment with Scenarios: Analyze various forecasts to evaluate different valuation results.
- 5. Utilize with Assurance: Present comprehensive valuation analyses to back your strategic decisions.
Why Choose This Calculator for Sichuan Anning Iron and Titanium Co., Ltd. (002978SZ)?
- User-Friendly Interface: Perfect for both newcomers and seasoned professionals.
- Customizable Variables: Effortlessly adjust parameters to suit your specific analysis.
- Real-Time Adjustments: Observe immediate changes in Sichuan Anning Iron and Titanium’s valuation as you tweak the inputs.
- Preloaded Data: Comes equipped with Sichuan Anning’s actual financial figures for swift assessment.
- Relied Upon by Experts: Favored by investors and analysts for making well-informed decisions.
Who Should Utilize This Product?
- Investors: Accurately assess the fair value of Sichuan Anning Iron and Titanium Co., Ltd. (002978SZ) before making investment choices.
- CFOs: Utilize a professional-grade DCF model for thorough financial reporting and analysis.
- Consultants: Efficiently customize the template for client valuation reports.
- Entrepreneurs: Acquire insights into the financial modeling practices of leading companies in the industry.
- Educators: Employ it as a pedagogical resource to illustrate valuation techniques.
What the Template Contains
- Pre-Filled DCF Model: Sichuan Anning Iron and Titanium Co., Ltd.'s financial data preloaded for immediate application.
- WACC Calculator: Comprehensive calculations for the Weighted Average Cost of Capital.
- Financial Ratios: Assess Sichuan Anning Iron and Titanium's profitability, leverage, and operational efficiency.
- Editable Inputs: Adjust key assumptions such as growth rates, profit margins, and capital expenditures to align with your scenarios.
- Financial Statements: Access annual and quarterly reports to facilitate in-depth analysis.
- Interactive Dashboard: Effortlessly visualize essential valuation metrics and outcomes.
Disclaimer
All information, articles, and product details provided on this website are for general informational and educational purposes only. We do not claim any ownership over, nor do we intend to infringe upon, any trademarks, copyrights, logos, brand names, or other intellectual property mentioned or depicted on this site. Such intellectual property remains the property of its respective owners, and any references here are made solely for identification or informational purposes, without implying any affiliation, endorsement, or partnership.
We make no representations or warranties, express or implied, regarding the accuracy, completeness, or suitability of any content or products presented. Nothing on this website should be construed as legal, tax, investment, financial, medical, or other professional advice. In addition, no part of this site—including articles or product references—constitutes a solicitation, recommendation, endorsement, advertisement, or offer to buy or sell any securities, franchises, or other financial instruments, particularly in jurisdictions where such activity would be unlawful.
All content is of a general nature and may not address the specific circumstances of any individual or entity. It is not a substitute for professional advice or services. Any actions you take based on the information provided here are strictly at your own risk. You accept full responsibility for any decisions or outcomes arising from your use of this website and agree to release us from any liability in connection with your use of, or reliance upon, the content or products found herein.