
|
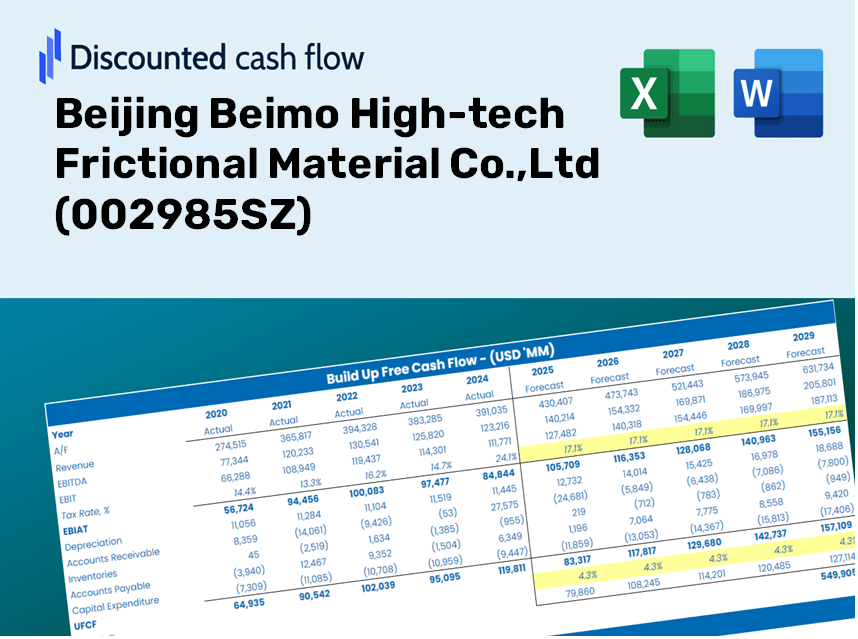
Beijing Beimo High-Tech-Reibungsmaterial Co., Ltd (002985.SZ) DCF-Bewertung |
Fully Editable: Tailor To Your Needs In Excel Or Sheets
Professional Design: Trusted, Industry-Standard Templates
Investor-Approved Valuation Models
MAC/PC Compatible, Fully Unlocked
No Expertise Is Needed; Easy To Follow
Beijing Beimo High-tech Frictional Material Co.,Ltd (002985.SZ) Bundle
Optimieren Sie Ihre Zeit und verbessern Sie die Präzision mit unserem DCF -Taschenrechner (002985SZ)! Mit tatsächlichen Daten von Beijing Beimo High-Tech-Reibungsmaterial Co., Ltd und anpassbaren Annahmen ermöglichen dieses Tool Sie, wie ein erfahrener Investor prognostiziert, analysieren und value (002985SZ).
Discounted Cash Flow (DCF) - (USD MM)
| Year | AY1 2020 |
AY2 2021 |
AY3 2022 |
AY4 2023 |
AY5 2024 |
FY1 2025 |
FY2 2026 |
FY3 2027 |
FY4 2028 |
FY5 2029 |
|---|---|---|---|---|---|---|---|---|---|---|
| Revenue | 686.7 | 1,132.4 | 997.9 | 954.0 | 537.9 | 544.6 | 551.5 | 558.4 | 565.4 | 572.5 |
| Revenue Growth, % | 0 | 64.91 | -11.88 | -4.39 | -43.62 | 1.25 | 1.25 | 1.25 | 1.25 | 1.25 |
| EBITDA | 420.9 | 721.2 | 525.9 | 385.4 | 98.5 | 257.5 | 260.7 | 264.0 | 267.3 | 270.7 |
| EBITDA, % | 61.3 | 63.69 | 52.7 | 40.4 | 18.31 | 47.28 | 47.28 | 47.28 | 47.28 | 47.28 |
| Depreciation | 20.7 | 44.4 | 62.1 | 90.8 | 69.0 | 38.7 | 39.2 | 39.7 | 40.2 | 40.7 |
| Depreciation, % | 3.02 | 3.92 | 6.23 | 9.52 | 12.83 | 7.1 | 7.1 | 7.1 | 7.1 | 7.1 |
| EBIT | 400.2 | 676.8 | 463.8 | 294.6 | 29.5 | 218.8 | 221.6 | 224.3 | 227.2 | 230.0 |
| EBIT, % | 58.29 | 59.77 | 46.48 | 30.88 | 5.48 | 40.18 | 40.18 | 40.18 | 40.18 | 40.18 |
| Total Cash | 722.1 | 1,145.1 | 714.6 | 782.6 | 405.0 | 467.2 | 473.1 | 479.0 | 485.0 | 491.1 |
| Total Cash, percent | .0 | .0 | .0 | .0 | .0 | .0 | .0 | .0 | .0 | .0 |
| Account Receivables | 1,195.6 | 1,671.1 | 1,970.9 | 2,015.7 | 1,715.6 | 544.6 | 551.5 | 558.4 | 565.4 | 572.5 |
| Account Receivables, % | 174.11 | 147.57 | 197.51 | 211.28 | 318.94 | 100 | 100 | 100 | 100 | 100 |
| Inventories | 217.1 | 364.5 | 543.8 | 720.0 | 889.6 | 320.0 | 324.0 | 328.1 | 332.2 | 336.4 |
| Inventories, % | 31.62 | 32.19 | 54.49 | 75.47 | 165.39 | 58.75 | 58.75 | 58.75 | 58.75 | 58.75 |
| Accounts Payable | 201.4 | 308.4 | 382.4 | 527.3 | 580.2 | 272.5 | 275.9 | 279.4 | 282.9 | 286.4 |
| Accounts Payable, % | 29.33 | 27.23 | 38.32 | 55.27 | 107.87 | 50.03 | 50.03 | 50.03 | 50.03 | 50.03 |
| Capital Expenditure | -24.3 | -122.2 | -163.8 | -121.7 | -80.7 | -63.7 | -64.5 | -65.3 | -66.2 | -67.0 |
| Capital Expenditure, % | -3.54 | -10.79 | -16.42 | -12.76 | -15 | -11.7 | -11.7 | -11.7 | -11.7 | -11.7 |
| Tax Rate, % | 17.38 | 17.38 | 17.38 | 17.38 | 17.38 | 17.38 | 17.38 | 17.38 | 17.38 | 17.38 |
| EBITAT | 316.0 | 422.5 | 316.6 | 219.4 | 24.3 | 160.5 | 162.5 | 164.6 | 166.6 | 168.7 |
| Depreciation | ||||||||||
| Changes in Account Receivables | ||||||||||
| Changes in Inventories | ||||||||||
| Changes in Accounts Payable | ||||||||||
| Capital Expenditure | ||||||||||
| UFCF | -898.8 | -171.2 | -190.1 | 112.4 | 196.0 | 1,568.3 | 129.7 | 131.4 | 133.0 | 134.7 |
| WACC, % | 5.76 | 5.74 | 5.75 | 5.75 | 5.76 | 5.75 | 5.75 | 5.75 | 5.75 | 5.75 |
| PV UFCF | ||||||||||
| SUM PV UFCF | 1,918.2 | |||||||||
| Long Term Growth Rate, % | 4.00 | |||||||||
| Free cash flow (T + 1) | 140 | |||||||||
| Terminal Value | 7,994 | |||||||||
| Present Terminal Value | 6,044 | |||||||||
| Enterprise Value | 7,962 | |||||||||
| Net Debt | -45 | |||||||||
| Equity Value | 8,007 | |||||||||
| Diluted Shares Outstanding, MM | 323 | |||||||||
| Equity Value Per Share | 24.78 |
What You Will Receive
- Adjustable Forecast Parameters: Seamlessly modify key assumptions (growth %, margins, WACC) to explore various scenarios.
- Industry-Specific Data: Beijing Beimo High-tech Frictional Material Co.,Ltd's financial metrics pre-loaded to enhance your analysis.
- Automated DCF Calculations: The template computes Net Present Value (NPV) and intrinsic value for your convenience.
- Customizable and Professional Design: A refined Excel model that caters to your valuation requirements.
- Designed for Analysts and Investors: Perfect for evaluating forecasts, confirming strategies, and optimizing efficiency.
Key Features
- Pre-Loaded Data: Historical financial statements and pre-filled forecasts for Beijing Beimo High-tech Frictional Material Co., Ltd (002985SZ).
- Fully Customizable Inputs: Adjust WACC, tax rates, revenue growth, and EBITDA margins to suit your analysis.
- Real-Time Results: Instantly view the intrinsic value of Beijing Beimo High-tech Frictional Material Co.,Ltd (002985SZ) as calculations update live.
- Visual Output Clarity: Dashboard charts provide clear displays of valuation results and essential metrics.
- Engineered for Precision: A robust tool designed for analysts, investors, and financial professionals.
How It Functions
- Download: Obtain the comprehensive Excel file containing financial data for Beijing Beimo High-tech Frictional Material Co.,Ltd (002985SZ).
- Customize: Modify forecasts such as revenue growth, EBITDA %, and WACC according to your analysis.
- Real-time Updates: The intrinsic value and NPV calculations refresh automatically as changes are made.
- Analyze Scenarios: Develop various projections and instantly compare the results.
- Make Informed Decisions: Leverage the valuation findings to inform your investment approach.
Why Choose This Calculator for Beijing Beimo High-tech Frictional Material Co., Ltd (002985SZ)?
- Accurate Data: Utilizes real financial metrics from Beijing Beimo for dependable valuation outcomes.
- Customizable: Tailor essential inputs like growth rates, WACC, and tax rates to align with your forecasts.
- Time-Saving: Ready-made calculations help you avoid starting from the ground up.
- Professional-Grade Tool: Perfectly crafted for investors, analysts, and consultants alike.
- User-Friendly: Designed with an intuitive interface and clear instructions to facilitate ease of use for everyone.
Who Can Benefit from This Product?
- Material Science Students: Explore advanced friction materials and apply theoretical knowledge through hands-on data.
- Researchers: Utilize industry-standard models for your studies or projects related to frictional materials.
- Manufacturers: Assess your production strategies and analyze the performance metrics of Beijing Beimo High-tech Frictional Material Co., Ltd (002985SZ).
- Quality Analysts: Enhance your efficiency with a customizable framework designed for evaluating friction materials.
- Entrepreneurs: Discover how established companies like Beijing Beimo High-tech Frictional Material Co., Ltd (002985SZ) approach market analysis.
What the Template Contains
- Historical Data: Features past financial performance and baseline forecasts for Beijing Beimo High-tech Frictional Material Co.,Ltd (002985SZ).
- DCF and Levered DCF Models: Comprehensive templates to assess the intrinsic value of Beijing Beimo High-tech Frictional Material Co.,Ltd (002985SZ).
- WACC Sheet: Built-in calculations for the Weighted Average Cost of Capital specific to Beijing Beimo High-tech Frictional Material Co.,Ltd (002985SZ).
- Editable Inputs: Adjust important variables such as growth rates, EBITDA percentage, and CAPEX projections for Beijing Beimo High-tech Frictional Material Co.,Ltd (002985SZ).
- Quarterly and Annual Statements: A thorough analysis of the financial statements of Beijing Beimo High-tech Frictional Material Co.,Ltd (002985SZ).
- Interactive Dashboard: Dynamically visualize valuation outcomes and future forecasts for Beijing Beimo High-tech Frictional Material Co.,Ltd (002985SZ).
Disclaimer
All information, articles, and product details provided on this website are for general informational and educational purposes only. We do not claim any ownership over, nor do we intend to infringe upon, any trademarks, copyrights, logos, brand names, or other intellectual property mentioned or depicted on this site. Such intellectual property remains the property of its respective owners, and any references here are made solely for identification or informational purposes, without implying any affiliation, endorsement, or partnership.
We make no representations or warranties, express or implied, regarding the accuracy, completeness, or suitability of any content or products presented. Nothing on this website should be construed as legal, tax, investment, financial, medical, or other professional advice. In addition, no part of this site—including articles or product references—constitutes a solicitation, recommendation, endorsement, advertisement, or offer to buy or sell any securities, franchises, or other financial instruments, particularly in jurisdictions where such activity would be unlawful.
All content is of a general nature and may not address the specific circumstances of any individual or entity. It is not a substitute for professional advice or services. Any actions you take based on the information provided here are strictly at your own risk. You accept full responsibility for any decisions or outcomes arising from your use of this website and agree to release us from any liability in connection with your use of, or reliance upon, the content or products found herein.