
|
Shaanxi Zhongtian Rocket Technology Co., Ltd (003009.SZ) DCF -Bewertung |
Fully Editable: Tailor To Your Needs In Excel Or Sheets
Professional Design: Trusted, Industry-Standard Templates
Investor-Approved Valuation Models
MAC/PC Compatible, Fully Unlocked
No Expertise Is Needed; Easy To Follow
Shaanxi Zhongtian Rocket Technology Co., Ltd (003009.SZ) Bundle
Gewinnen Sie Einblicke in Ihre Shaanxi Zhongtian Rocket Technology Co., Ltd (003009SZ) Bewertungsanalyse mit unserem hochmodernen DCF-Taschenrechner! Diese Excel -Vorlage wird mit realen (003009SZ) Daten vorinstalliert, sodass Sie Prognosen und Annahmen anpassen können, um den inneren Wert von Shaanxi Zhongtian Rocket Technology Co., Ltd. genau zu bestimmen.
Discounted Cash Flow (DCF) - (USD MM)
| Year | AY1 2020 |
AY2 2021 |
AY3 2022 |
AY4 2023 |
AY5 2024 |
FY1 2025 |
FY2 2026 |
FY3 2027 |
FY4 2028 |
FY5 2029 |
|---|---|---|---|---|---|---|---|---|---|---|
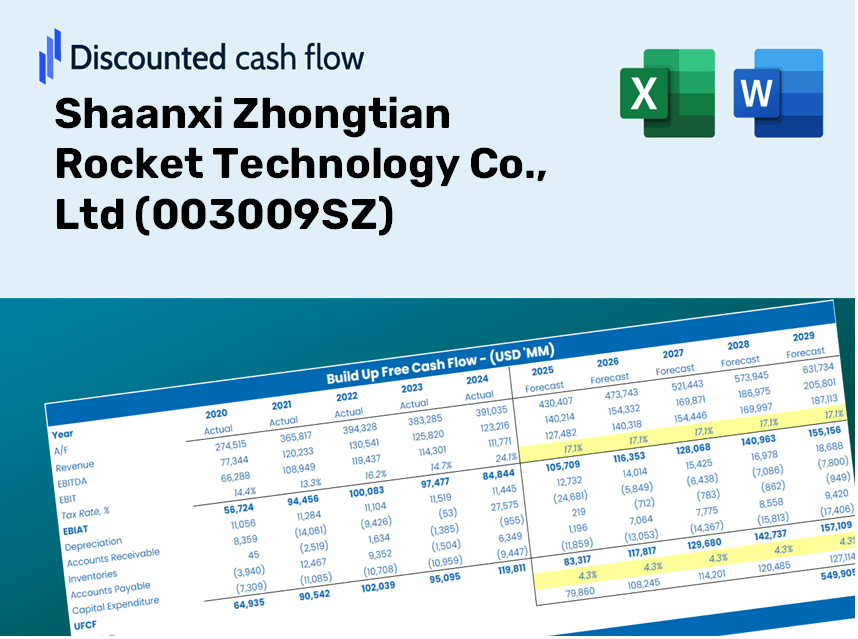
| Revenue | 863.3 | 1,015.1 | 1,235.7 | 1,180.1 | 924.7 | 955.2 | 986.6 | 1,019.1 | 1,052.7 | 1,087.4 |
| Revenue Growth, % | 0 | 17.58 | 21.74 | -4.5 | -21.64 | 3.29 | 3.29 | 3.29 | 3.29 | 3.29 |
| EBITDA | 140.1 | 138.6 | 174.8 | 131.9 | 57.5 | 117.4 | 121.2 | 125.2 | 129.3 | 133.6 |
| EBITDA, % | 16.23 | 13.65 | 14.15 | 11.18 | 6.22 | 12.29 | 12.29 | 12.29 | 12.29 | 12.29 |
| Depreciation | 27.3 | 26.9 | 30.9 | 42.0 | 50.7 | 33.1 | 34.2 | 35.4 | 36.5 | 37.7 |
| Depreciation, % | 3.16 | 2.65 | 2.5 | 3.56 | 5.48 | 3.47 | 3.47 | 3.47 | 3.47 | 3.47 |
| EBIT | 112.8 | 111.7 | 144.0 | 90.0 | 6.8 | 84.2 | 87.0 | 89.9 | 92.8 | 95.9 |
| EBIT, % | 13.07 | 11 | 11.65 | 7.62 | 0.73774 | 8.82 | 8.82 | 8.82 | 8.82 | 8.82 |
| Total Cash | 666.2 | 574.7 | 1,289.6 | 1,209.3 | 935.7 | 828.7 | 856.0 | 884.2 | 913.3 | 943.4 |
| Total Cash, percent | .0 | .0 | .0 | .0 | .0 | .0 | .0 | .0 | .0 | .0 |
| Account Receivables | 373.2 | 441.9 | 643.3 | 660.5 | 614.7 | 499.1 | 515.6 | 532.5 | 550.1 | 568.2 |
| Account Receivables, % | 43.23 | 43.53 | 52.06 | 55.97 | 66.47 | 52.25 | 52.25 | 52.25 | 52.25 | 52.25 |
| Inventories | 202.1 | 236.6 | 293.5 | 290.7 | 408.0 | 266.0 | 274.7 | 283.8 | 293.1 | 302.8 |
| Inventories, % | 23.41 | 23.31 | 23.75 | 24.63 | 44.12 | 27.85 | 27.85 | 27.85 | 27.85 | 27.85 |
| Accounts Payable | 314.9 | 360.7 | 543.5 | 577.6 | 621.9 | 443.6 | 458.2 | 473.3 | 488.9 | 505.0 |
| Accounts Payable, % | 36.48 | 35.53 | 43.98 | 48.94 | 67.26 | 46.44 | 46.44 | 46.44 | 46.44 | 46.44 |
| Capital Expenditure | -34.5 | -124.1 | -60.9 | -120.0 | -242.0 | -109.8 | -113.5 | -117.2 | -121.1 | -125.0 |
| Capital Expenditure, % | -4 | -12.23 | -4.93 | -10.17 | -26.18 | -11.5 | -11.5 | -11.5 | -11.5 | -11.5 |
| Tax Rate, % | -28.21 | -28.21 | -28.21 | -28.21 | -28.21 | -28.21 | -28.21 | -28.21 | -28.21 | -28.21 |
| EBITAT | 102.4 | 101.4 | 140.3 | 85.5 | 8.7 | 79.9 | 82.5 | 85.2 | 88.0 | 90.9 |
| Depreciation | ||||||||||
| Changes in Account Receivables | ||||||||||
| Changes in Inventories | ||||||||||
| Changes in Accounts Payable | ||||||||||
| Capital Expenditure | ||||||||||
| UFCF | -165.3 | -53.1 | 34.7 | 27.2 | -209.6 | 82.3 | -7.3 | -7.6 | -7.8 | -8.1 |
| WACC, % | 6.99 | 6.99 | 7.01 | 7 | 7.01 | 7 | 7 | 7 | 7 | 7 |
| PV UFCF | ||||||||||
| SUM PV UFCF | 52.6 | |||||||||
| Long Term Growth Rate, % | 3.00 | |||||||||
| Free cash flow (T + 1) | -8 | |||||||||
| Terminal Value | -208 | |||||||||
| Present Terminal Value | -149 | |||||||||
| Enterprise Value | -96 | |||||||||
| Net Debt | -309 | |||||||||
| Equity Value | 213 | |||||||||
| Diluted Shares Outstanding, MM | 155 | |||||||||
| Equity Value Per Share | 1.37 |
What You Will Receive
- Accurate 003009SZ Financial Data: Features both historical and projected figures for precise valuation.
- Customizable Inputs: Adjust WACC, tax rates, revenue growth, and capital expenditures as needed.
- Automated Calculations: Intrinsic value and NPV are computed in real-time.
- Scenario Analysis: Evaluate various scenarios to assess the future performance of Shaanxi Zhongtian Rocket Technology Co., Ltd.
- User-Friendly Interface: Designed for industry professionals while remaining accessible to newcomers.
Key Features
- 🔍 Real-Life (003009SZ) Financials: Pre-filled historical and projected data for Shaanxi Zhongtian Rocket Technology Co., Ltd.
- ✏️ Fully Customizable Inputs: Adjust all critical parameters (yellow cells) such as WACC, growth %, and tax rates.
- 📊 Professional DCF Valuation: Built-in formulas calculate the intrinsic value of Shaanxi Zhongtian Rocket Technology using the Discounted Cash Flow method.
- ⚡ Instant Results: Visualize the company's valuation instantly after making adjustments.
- Scenario Analysis: Evaluate and compare results for different financial assumptions side-by-side.
How It Works
- Step 1: Download the prebuilt Excel template containing data for Shaanxi Zhongtian Rocket Technology Co., Ltd (003009SZ).
- Step 2: Review the populated sheets to familiarize yourself with the essential metrics.
- Step 3: Modify the forecasts and assumptions in the editable yellow cells (WACC, growth, margins).
- Step 4: Instantly see the recalibrated results, including the intrinsic value of Shaanxi Zhongtian Rocket Technology Co., Ltd (003009SZ).
- Step 5: Utilize the outputs to make informed investment decisions or generate comprehensive reports.
Why Choose This Calculator for Shaanxi Zhongtian Rocket Technology Co., Ltd (003009SZ)?
- Reliable Data: Access real financials from Shaanxi Zhongtian Rocket Technology for trustworthy valuation outcomes.
- Fully Customizable: Tailor essential parameters such as growth rates, WACC, and tax rates to align with your forecasts.
- Efficiency Boost: Built-in calculations reduce the hassle of starting from the ground up.
- Professional Quality: Crafted for investors, analysts, and consultants in the aerospace sector.
- Easy to Use: A straightforward interface and guided instructions ensure a seamless experience for all users.
Who Can Benefit from Shaanxi Zhongtian Rocket Technology Co., Ltd (003009SZ)?
- Investors: Make informed investment choices with a sophisticated valuation tool tailored for the aerospace sector.
- Financial Analysts: Streamline your analysis with a customizable DCF model specific to rocket technology.
- Consultants: Efficiently modify the template for impactful client presentations or comprehensive reports.
- Aerospace Enthusiasts: Enhance your understanding of valuation methodologies with applicable examples from the industry.
- Educators and Students: Utilize it as a hands-on resource in aerospace finance and related courses.
Contents of the Template
- Pre-Populated Data: Features Shaanxi Zhongtian Rocket Technology Co., Ltd's historical financials and projections.
- Discounted Cash Flow Model: Customizable DCF valuation model with automated calculations.
- Weighted Average Cost of Capital (WACC): A specific sheet designed for computing WACC using tailored inputs.
- Essential Financial Ratios: Evaluate Shaanxi Zhongtian's profitability, efficiency, and leverage.
- Adjustable Inputs: Easily modify revenue growth, profit margins, and tax rates.
- Concise Dashboard: Visual representations and tables summarizing critical valuation outcomes.
Disclaimer
All information, articles, and product details provided on this website are for general informational and educational purposes only. We do not claim any ownership over, nor do we intend to infringe upon, any trademarks, copyrights, logos, brand names, or other intellectual property mentioned or depicted on this site. Such intellectual property remains the property of its respective owners, and any references here are made solely for identification or informational purposes, without implying any affiliation, endorsement, or partnership.
We make no representations or warranties, express or implied, regarding the accuracy, completeness, or suitability of any content or products presented. Nothing on this website should be construed as legal, tax, investment, financial, medical, or other professional advice. In addition, no part of this site—including articles or product references—constitutes a solicitation, recommendation, endorsement, advertisement, or offer to buy or sell any securities, franchises, or other financial instruments, particularly in jurisdictions where such activity would be unlawful.
All content is of a general nature and may not address the specific circumstances of any individual or entity. It is not a substitute for professional advice or services. Any actions you take based on the information provided here are strictly at your own risk. You accept full responsibility for any decisions or outcomes arising from your use of this website and agree to release us from any liability in connection with your use of, or reliance upon, the content or products found herein.