
|
Guoco Group Limited (0053.HK) DCF -Bewertung |
Fully Editable: Tailor To Your Needs In Excel Or Sheets
Professional Design: Trusted, Industry-Standard Templates
Investor-Approved Valuation Models
MAC/PC Compatible, Fully Unlocked
No Expertise Is Needed; Easy To Follow
Guoco Group Limited (0053.HK) Bundle
Mit unserem DCF-Taschenrechner (0053HK) für Genauigkeit können Sie die Bewertung von Guoco Group Limited unter Verwendung realer Finanzdaten bewerten und vollständige Flexibilität bieten, um alle wesentlichen Parameter für erweiterte Projektionen zu ändern.
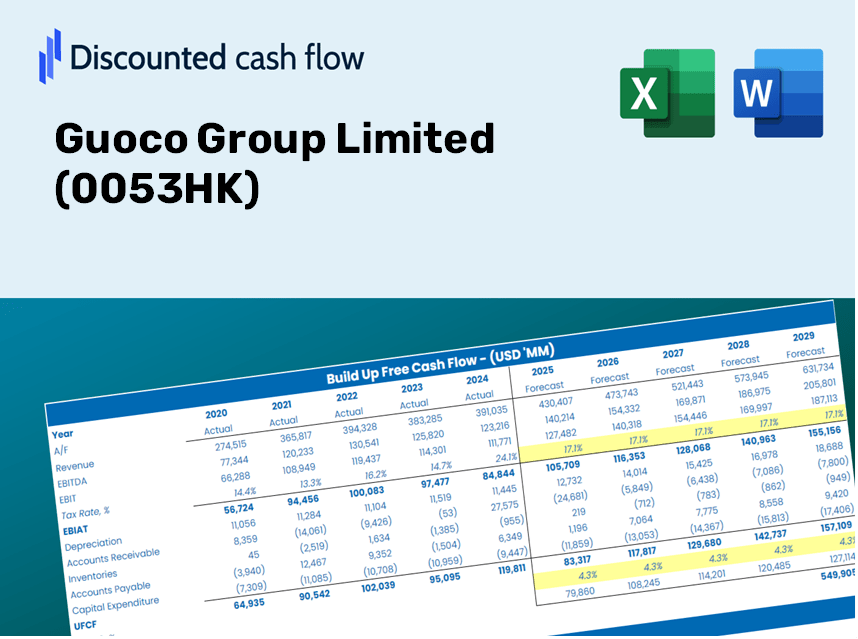
Discounted Cash Flow (DCF) - (USD MM)
| Year | AY1 2021 |
AY2 2022 |
AY3 2023 |
AY4 2024 |
AY5 2025 |
FY1 2026 |
FY2 2027 |
FY3 2028 |
FY4 2029 |
FY5 2030 |
|---|---|---|---|---|---|---|---|---|---|---|
| Revenue | 10,260.5 | 14,763.5 | 19,345.5 | 22,415.8 | 24,196.1 | 30,168.6 | 37,615.4 | 46,900.3 | 58,477.1 | 72,911.5 |
| Revenue Growth, % | 0 | 43.89 | 31.04 | 15.87 | 7.94 | 24.68 | 24.68 | 24.68 | 24.68 | 24.68 |
| EBITDA | 1,825.9 | 4,011.1 | 2,928.1 | 7,527.6 | 6,501.8 | 7,273.9 | 9,069.3 | 11,308.0 | 14,099.2 | 17,579.5 |
| EBITDA, % | 17.8 | 27.17 | 15.14 | 33.58 | 26.87 | 24.11 | 24.11 | 24.11 | 24.11 | 24.11 |
| Depreciation | 1,018.5 | 945.6 | 793.6 | 981.4 | 726.2 | 1,678.1 | 2,092.4 | 2,608.8 | 3,252.8 | 4,055.7 |
| Depreciation, % | 9.93 | 6.4 | 4.1 | 4.38 | 3 | 5.56 | 5.56 | 5.56 | 5.56 | 5.56 |
| EBIT | 807.5 | 3,065.5 | 2,134.5 | 6,546.2 | 5,775.6 | 5,595.7 | 6,977.0 | 8,699.2 | 10,846.4 | 13,523.8 |
| EBIT, % | 7.87 | 20.76 | 11.03 | 29.2 | 23.87 | 18.55 | 18.55 | 18.55 | 18.55 | 18.55 |
| Total Cash | 167,424.1 | 160,018.9 | 174,714.2 | 24,414.8 | 25,340.0 | 30,168.6 | 37,615.4 | 46,900.3 | 58,477.1 | 72,911.5 |
| Total Cash, percent | .0 | .0 | .0 | .0 | .0 | .0 | .0 | .0 | .0 | .0 |
| Account Receivables | 33,811.2 | 22,752.5 | 14,323.3 | 6,177.6 | 21,254.3 | 23,497.8 | 29,297.9 | 36,529.8 | 45,546.7 | 56,789.4 |
| Account Receivables, % | 329.53 | 154.11 | 74.04 | 27.56 | 87.84 | 77.89 | 77.89 | 77.89 | 77.89 | 77.89 |
| Inventories | 174,415.0 | 184,660.3 | 171,948.6 | 16,244.7 | 1,733.7 | 22,906.1 | 28,560.2 | 35,610.0 | 44,399.9 | 55,359.5 |
| Inventories, % | 1699.86 | 1250.79 | 888.83 | 72.47 | 7.17 | 75.93 | 75.93 | 75.93 | 75.93 | 75.93 |
| Accounts Payable | 644.1 | 969.1 | 990.0 | 911.3 | 5,938.4 | 2,809.8 | 3,503.3 | 4,368.1 | 5,446.3 | 6,790.6 |
| Accounts Payable, % | 6.28 | 6.56 | 5.12 | 4.07 | 24.54 | 9.31 | 9.31 | 9.31 | 9.31 | 9.31 |
| Capital Expenditure | -162.5 | -328.7 | -485.5 | -740.1 | .0 | -580.5 | -723.8 | -902.5 | -1,125.3 | -1,403.1 |
| Capital Expenditure, % | -1.58 | -2.23 | -2.51 | -3.3 | 0 | -1.92 | -1.92 | -1.92 | -1.92 | -1.92 |
| Tax Rate, % | 23.37 | 23.37 | 23.37 | 23.37 | 23.37 | 23.37 | 23.37 | 23.37 | 23.37 | 23.37 |
| EBITAT | 822.3 | 1,655.4 | 1,897.3 | 5,308.9 | 4,425.8 | 4,483.5 | 5,590.2 | 6,970.1 | 8,690.5 | 10,835.7 |
| Depreciation | ||||||||||
| Changes in Account Receivables | ||||||||||
| Changes in Inventories | ||||||||||
| Changes in Accounts Payable | ||||||||||
| Capital Expenditure | ||||||||||
| UFCF | -205,903.9 | 3,410.7 | 23,367.3 | 169,321.0 | 9,613.5 | -20,963.5 | -3,802.0 | -4,740.5 | -5,910.6 | -7,369.6 |
| WACC, % | 4.44 | 3.14 | 4.12 | 3.9 | 3.78 | 3.88 | 3.88 | 3.88 | 3.88 | 3.88 |
| PV UFCF | ||||||||||
| SUM PV UFCF | -39,104.9 | |||||||||
| Long Term Growth Rate, % | 2.00 | |||||||||
| Free cash flow (T + 1) | -7,517 | |||||||||
| Terminal Value | -400,842 | |||||||||
| Present Terminal Value | -331,445 | |||||||||
| Enterprise Value | -370,550 | |||||||||
| Net Debt | 31,914 | |||||||||
| Equity Value | -402,464 | |||||||||
| Diluted Shares Outstanding, MM | 325 | |||||||||
| Equity Value Per Share | -1,237.14 |
What You Will Receive
- Authentic Guoco Group Financial Data: Pre-populated with Guoco Group Limited’s historical and forecasted financial information for accurate analysis.
- Completely Customizable Template: Effortlessly adjust key variables such as revenue growth, WACC, and EBITDA margins.
- Instantaneous Calculations: Watch Guoco Group’s intrinsic value update in real-time as you make adjustments.
- Advanced Valuation Tool: Tailored for investors, analysts, and consultants who demand precise DCF outcomes.
- Intuitive Interface: Easy-to-follow structure and guidance suitable for users of all skill levels.
Key Features
- 🔍 Real-Life GCL Financials: Pre-filled historical and projected data for Guoco Group Limited (0053HK).
- ✏️ Fully Customizable Inputs: Modify all essential parameters (yellow cells) such as WACC, growth %, and tax rates.
- 📊 Professional DCF Valuation: Integrated formulas determine Guoco Group’s intrinsic value using the Discounted Cash Flow method.
- ⚡ Instant Results: Visualize Guoco Group’s valuation immediately after adjustments.
- Scenario Analysis: Evaluate and compare results for different financial assumptions side by side.
How It Works
- Step 1: Download the Excel file.
- Step 2: Examine the pre-filled financial data and forecasts for Guoco Group Limited (0053HK).
- Step 3: Adjust key inputs such as revenue growth, WACC, and tax rates (highlighted cells).
- Step 4: Observe the DCF model update in real-time as you modify your assumptions.
- Step 5: Evaluate the outputs and utilize the findings for your investment strategies.
Why Choose This Calculator for Guoco Group Limited (0053HK)?
- Designed for Experts: A specialized tool utilized by analysts, CFOs, and financial consultants.
- Precise Financial Data: Guoco Group's historical and forecasted financials are preloaded for maximum accuracy.
- Scenario Analysis: Effortlessly test various projections and assumptions.
- Comprehensive Outputs: Instantly calculates intrinsic value, NPV, and essential financial metrics.
- User-Friendly: Step-by-step guidance ensures a smooth experience throughout the process.
Who Should Consider This Product?
- Finance Students: Master valuation techniques using real-world data for Guoco Group Limited (0053HK).
- Academics: Integrate advanced financial models into your research or educational programs.
- Investors: Validate your investment strategies and assess valuation results for Guoco Group Limited (0053HK).
- Analysts: Enhance your efficiency with a customizable, ready-to-use DCF model tailored for Guoco Group Limited (0053HK).
- Small Business Owners: Understand the analytical methods applied to major public companies like Guoco Group Limited (0053HK).
Contents of the Template
- Pre-Filled Data: Features Guoco Group Limited's historical financial performance and projections.
- Discounted Cash Flow Model: An editable DCF valuation model with automated calculations.
- Weighted Average Cost of Capital (WACC): A specific sheet for WACC calculations based on user-defined inputs.
- Key Financial Ratios: Assess Guoco Group Limited's profitability, efficiency, and financial leverage.
- Customizable Inputs: Easily adjust revenue growth, margins, and tax rates.
- Clear Dashboard: Visuals and tables summarizing essential valuation outcomes.
Disclaimer
All information, articles, and product details provided on this website are for general informational and educational purposes only. We do not claim any ownership over, nor do we intend to infringe upon, any trademarks, copyrights, logos, brand names, or other intellectual property mentioned or depicted on this site. Such intellectual property remains the property of its respective owners, and any references here are made solely for identification or informational purposes, without implying any affiliation, endorsement, or partnership.
We make no representations or warranties, express or implied, regarding the accuracy, completeness, or suitability of any content or products presented. Nothing on this website should be construed as legal, tax, investment, financial, medical, or other professional advice. In addition, no part of this site—including articles or product references—constitutes a solicitation, recommendation, endorsement, advertisement, or offer to buy or sell any securities, franchises, or other financial instruments, particularly in jurisdictions where such activity would be unlawful.
All content is of a general nature and may not address the specific circumstances of any individual or entity. It is not a substitute for professional advice or services. Any actions you take based on the information provided here are strictly at your own risk. You accept full responsibility for any decisions or outcomes arising from your use of this website and agree to release us from any liability in connection with your use of, or reliance upon, the content or products found herein.