
|
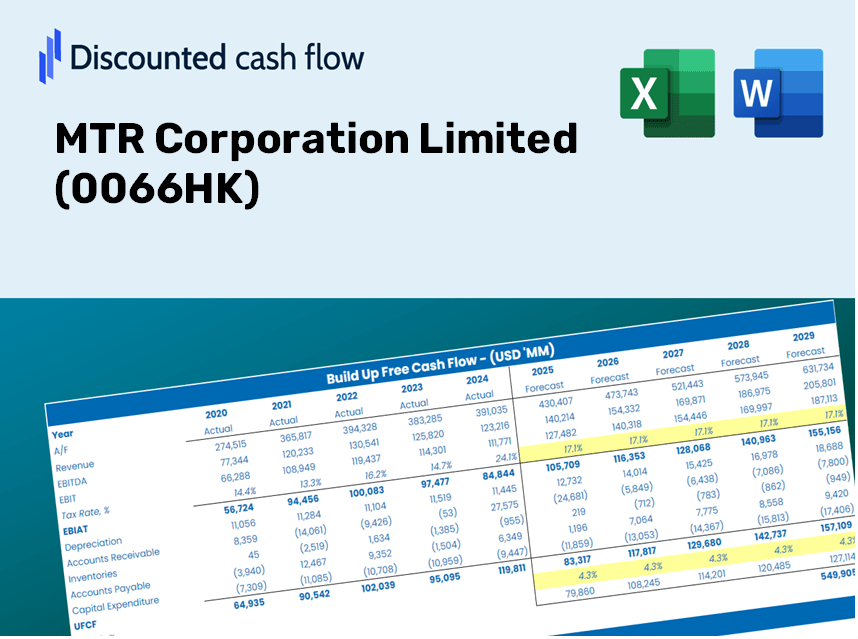
MTR Corporation Limited (0066.HK) DCF -Bewertung |
Fully Editable: Tailor To Your Needs In Excel Or Sheets
Professional Design: Trusted, Industry-Standard Templates
Investor-Approved Valuation Models
MAC/PC Compatible, Fully Unlocked
No Expertise Is Needed; Easy To Follow
MTR Corporation Limited (0066.HK) Bundle
Vereinfachen Sie die Bewertung der MTR Corporation Limited mit diesem anpassbaren DCF -Taschenrechner! Mit Real MTR Corporation Limited Financials und einstellbaren Prognoseeingaben können Sie Szenarien testen und MTR Corporation Limited Fair -Wert innerhalb von Minuten aufdecken.
What You Will Receive
- Authentic MTR Financial Data: Pre-loaded with MTR Corporation Limited’s historical and forecasted figures for accurate analysis.
- Completely Customizable Template: Easily adjust essential inputs such as revenue growth, WACC, and EBITDA margins.
- Instant Calculations: Watch MTR’s intrinsic value refresh immediately as you make updates.
- Expert Valuation Tool: Tailored for investors, analysts, and consultants aiming for precise DCF evaluations.
- Intuitive User Interface: Clear layout and straightforward instructions suitable for all skill levels.
Key Features
- Pre-Loaded Data: MTR Corporation Limited's historical financial statements and pre-filled forecasts.
- Fully Adjustable Inputs: Customize WACC, tax rates, revenue growth, and EBITDA margins.
- Instant Results: Observe MTR Corporation Limited's intrinsic value recalculated in real time.
- Clear Visual Outputs: Dashboard charts showcasing valuation results and key metrics.
- Built for Accuracy: A professional tool designed for analysts, investors, and finance experts.
How It Works
- Step 1: Download the Excel file.
- Step 2: Review the pre-filled data for MTR Corporation Limited (0066HK) (historical and projected).
- Step 3: Adjust the key assumptions (yellow cells) based on your analysis.
- Step 4: Observe the automatic recalculations for the intrinsic value of MTR Corporation Limited (0066HK).
- Step 5: Utilize the results for making investment decisions or reporting.
Why Select This Calculator for MTR Corporation Limited (0066HK)?
- User-Friendly Interface: Tailored for both novices and seasoned professionals.
- Customizable Inputs: Easily adjust parameters to align with your analysis needs.
- Real-Time Feedback: Observe immediate changes to MTR’s valuation as you modify the inputs.
- Preloaded Financials: Comes with MTR’s current financial data for swift evaluations.
- Relied Upon by Experts: A go-to tool for investors and analysts looking to make educated choices.
Who Can Benefit from MTR Corporation Limited (0066HK)?
- Finance Students: Discover valuation methods and apply them to real-world data.
- Academics: Utilize professional financial models in your research or teaching materials.
- Investors: Assess your own hypotheses and evaluate the valuation of MTR Corporation Limited (0066HK).
- Analysts: Enhance your efficiency with a customizable DCF model tailored for MTR Corporation Limited (0066HK).
- Small Business Owners: Learn how major public companies like MTR Corporation Limited (0066HK) are evaluated in the market.
Contents of the Template
- Pre-Filled Data: Contains MTR Corporation Limited's historical financials and projected forecasts.
- Discounted Cash Flow Model: An editable DCF valuation model featuring automatic calculations.
- Weighted Average Cost of Capital (WACC): A specific sheet for computing WACC based on user-defined inputs.
- Key Financial Ratios: Evaluate MTR Corporation Limited's profitability, efficiency, and leverage metrics.
- Customizable Inputs: Easily modify revenue growth, margins, and tax rates.
- Clear Dashboard: Visuals and tables that summarize essential valuation outcomes.
Disclaimer
All information, articles, and product details provided on this website are for general informational and educational purposes only. We do not claim any ownership over, nor do we intend to infringe upon, any trademarks, copyrights, logos, brand names, or other intellectual property mentioned or depicted on this site. Such intellectual property remains the property of its respective owners, and any references here are made solely for identification or informational purposes, without implying any affiliation, endorsement, or partnership.
We make no representations or warranties, express or implied, regarding the accuracy, completeness, or suitability of any content or products presented. Nothing on this website should be construed as legal, tax, investment, financial, medical, or other professional advice. In addition, no part of this site—including articles or product references—constitutes a solicitation, recommendation, endorsement, advertisement, or offer to buy or sell any securities, franchises, or other financial instruments, particularly in jurisdictions where such activity would be unlawful.
All content is of a general nature and may not address the specific circumstances of any individual or entity. It is not a substitute for professional advice or services. Any actions you take based on the information provided here are strictly at your own risk. You accept full responsibility for any decisions or outcomes arising from your use of this website and agree to release us from any liability in connection with your use of, or reliance upon, the content or products found herein.