
|
Sino Land Company Limited (0083.HK) DCF -Bewertung |
Fully Editable: Tailor To Your Needs In Excel Or Sheets
Professional Design: Trusted, Industry-Standard Templates
Investor-Approved Valuation Models
MAC/PC Compatible, Fully Unlocked
No Expertise Is Needed; Easy To Follow
Sino Land Company Limited (0083.HK) Bundle
Unabhängig davon, ob Sie ein Investor oder ein Analyst sind, ist dieser (0083HK) DCF-Taschenrechner Ihr Anlaufwerk für eine genaue Bewertung. Vorausgeladen mit realen Daten von Sino Land Company Limited können Sie Prognosen anpassen und sofort die Auswirkungen beobachten.
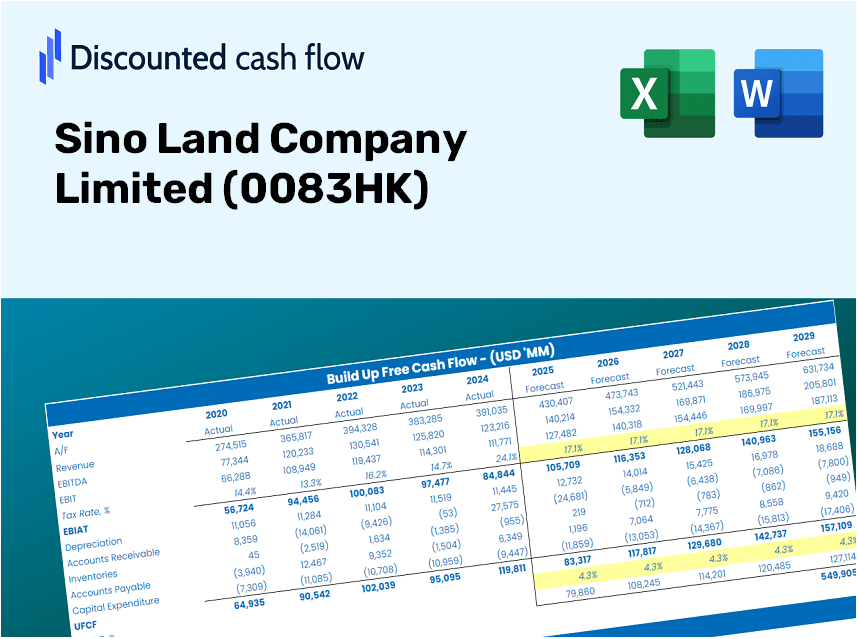
Discounted Cash Flow (DCF) - (USD MM)
| Year | AY1 2021 |
AY2 2022 |
AY3 2023 |
AY4 2024 |
AY5 2025 |
FY1 2026 |
FY2 2027 |
FY3 2028 |
FY4 2029 |
FY5 2030 |
|---|---|---|---|---|---|---|---|---|---|---|
| Revenue | 24,433.4 | 15,650.6 | 11,896.6 | 8,765.0 | 8,443.0 | 6,544.8 | 5,073.4 | 3,932.8 | 3,048.6 | 2,363.2 |
| Revenue Growth, % | 0 | -35.95 | -23.99 | -26.32 | -3.67 | -22.48 | -22.48 | -22.48 | -22.48 | -22.48 |
| EBITDA | 12,571.7 | 7,488.3 | 4,474.3 | 4,973.0 | 3,065.0 | 3,009.9 | 2,333.2 | 1,808.7 | 1,402.0 | 1,086.8 |
| EBITDA, % | 51.45 | 47.85 | 37.61 | 56.74 | 36.3 | 45.99 | 45.99 | 45.99 | 45.99 | 45.99 |
| Depreciation | 186.1 | 181.0 | 198.2 | 160.0 | 158.0 | 95.3 | 73.9 | 57.3 | 44.4 | 34.4 |
| Depreciation, % | 0.76186 | 1.16 | 1.67 | 1.83 | 1.87 | 1.46 | 1.46 | 1.46 | 1.46 | 1.46 |
| EBIT | 12,385.5 | 7,307.3 | 4,276.2 | 4,813.0 | 2,907.0 | 2,914.6 | 2,259.4 | 1,751.4 | 1,357.6 | 1,052.4 |
| EBIT, % | 50.69 | 46.69 | 35.94 | 54.91 | 34.43 | 44.53 | 44.53 | 44.53 | 44.53 | 44.53 |
| Total Cash | 44,144.0 | 44,792.4 | 43,940.7 | 46,430.0 | 51,268.0 | 6,544.8 | 5,073.4 | 3,932.8 | 3,048.6 | 2,363.2 |
| Total Cash, percent | .0 | .0 | .0 | .0 | .0 | .0 | .0 | .0 | .0 | .0 |
| Account Receivables | 7,351.7 | 6,104.3 | 7,251.0 | 8,192.0 | 9,448.0 | 4,234.6 | 3,282.5 | 2,544.5 | 1,972.5 | 1,529.0 |
| Account Receivables, % | 30.09 | 39 | 60.95 | 93.46 | 111.9 | 64.7 | 64.7 | 64.7 | 64.7 | 64.7 |
| Inventories | 23,251.5 | 20,536.2 | 16,484.2 | 15,810.0 | .0 | 5,172.5 | 4,009.6 | 3,108.2 | 2,409.4 | 1,867.7 |
| Inventories, % | 95.16 | 131.22 | 138.56 | 180.38 | 0 | 79.03 | 79.03 | 79.03 | 79.03 | 79.03 |
| Accounts Payable | 5,120.2 | 5,335.2 | 5,059.0 | 4,391.0 | .0 | 1,932.9 | 1,498.3 | 1,161.5 | 900.4 | 697.9 |
| Accounts Payable, % | 20.96 | 34.09 | 42.52 | 50.1 | 0 | 29.53 | 29.53 | 29.53 | 29.53 | 29.53 |
| Capital Expenditure | -38.0 | -52.5 | -107.7 | -69.0 | -113.0 | -46.1 | -35.7 | -27.7 | -21.5 | -16.6 |
| Capital Expenditure, % | -0.15548 | -0.33536 | -0.90567 | -0.78722 | -1.34 | -0.70442 | -0.70442 | -0.70442 | -0.70442 | -0.70442 |
| Tax Rate, % | 10.13 | 10.13 | 10.13 | 10.13 | 10.13 | 10.13 | 10.13 | 10.13 | 10.13 | 10.13 |
| EBITAT | 9,186.3 | 5,730.3 | 3,710.6 | 4,441.7 | 2,612.5 | 2,457.1 | 1,904.7 | 1,476.5 | 1,144.5 | 887.2 |
| Depreciation | ||||||||||
| Changes in Account Receivables | ||||||||||
| Changes in Inventories | ||||||||||
| Changes in Accounts Payable | ||||||||||
| Capital Expenditure | ||||||||||
| UFCF | -16,148.6 | 10,036.5 | 6,430.1 | 3,597.9 | 12,820.5 | 4,480.1 | 3,623.2 | 2,808.6 | 2,177.2 | 1,687.7 |
| WACC, % | 5.87 | 5.88 | 5.88 | 5.89 | 5.88 | 5.88 | 5.88 | 5.88 | 5.88 | 5.88 |
| PV UFCF | ||||||||||
| SUM PV UFCF | 12,830.3 | |||||||||
| Long Term Growth Rate, % | 2.00 | |||||||||
| Free cash flow (T + 1) | 1,721 | |||||||||
| Terminal Value | 44,369 | |||||||||
| Present Terminal Value | 33,344 | |||||||||
| Enterprise Value | 46,174 | |||||||||
| Net Debt | -14,931 | |||||||||
| Equity Value | 61,105 | |||||||||
| Diluted Shares Outstanding, MM | 8,887 | |||||||||
| Equity Value Per Share | 6.88 |
What You Will Receive
- Genuine Sino Land Data: Preloaded financials – encompassing everything from revenue to EBIT – based on actual and forecasted figures.
- Comprehensive Customization: Modify all essential parameters (yellow cells) such as WACC, growth %, and tax rates.
- Real-Time Valuation Updates: Automatic recalculations to assess the impact of changes on Sino Land's fair value.
- Flexible Excel Template: Designed for quick modifications, scenario analysis, and detailed projections.
- Efficient and Precise: Bypass creating models from the ground up while ensuring accuracy and adaptability.
Key Features
- Actual Sino Land Data: Pre-loaded with historical financial metrics and forward-looking estimates for Sino Land Company Limited (0083HK).
- Completely Customizable Inputs: Modify growth rates, profit margins, discount rates, tax percentages, and capital expenditures.
- Interactive Valuation Model: Automatically adjusts Net Present Value (NPV) and intrinsic value based on your customized inputs.
- What-If Analysis: Develop various forecasting scenarios to evaluate different valuation possibilities.
- Intuitive Interface: Designed to be clear and easy to navigate for both professionals and novices.
How It Functions
- Download the Template: Gain immediate access to the Excel-based Sino Land Company DCF Calculator.
- Input Your Assumptions: Modify the yellow-highlighted cells for growth rates, WACC, margins, and other variables.
- Instant Calculations: The model automatically recalculates the intrinsic value of Sino Land Company (0083HK).
- Test Scenarios: Experiment with different assumptions to assess potential changes in valuation.
- Analyze and Decide: Utilize the results to inform your investment or financial analysis.
Why Opt for the Sino Land Company Limited (0083HK) Calculator?
- Time Efficient: Skip the hassle of building a DCF model from scratch – it’s ready for immediate use.
- Enhanced Accuracy: Dependable financial data and formulas diminish valuation errors.
- Fully Adjustable: Customize the model to align with your assumptions and projections.
- User-Friendly Outputs: Straightforward charts and results facilitate easy analysis.
- Endorsed by Professionals: Tailored for experts who prioritize precision and functionality.
Who Can Benefit from Sino Land Company Limited (0083HK)?
- Investors: Make informed choices with a top-notch valuation tool designed for precision.
- Financial Analysts: Streamline your workflow with an easily customizable DCF model at your fingertips.
- Consultants: Effortlessly modify the template for impactful client presentations or detailed reports.
- Finance Enthusiasts: Enhance your grasp of valuation methods through practical, real-world scenarios.
- Educators and Students: Utilize this resource as an effective teaching aid in finance-oriented programs.
Contents of the Template
- Preloaded 0083HK Data: Historical and projected financial information, including revenue, EBIT, and capital expenditures.
- DCF and WACC Models: Professional-grade spreadsheets designed for calculating intrinsic value and Weighted Average Cost of Capital.
- Editable Inputs: Cells highlighted in yellow for customizing revenue growth, tax rates, and discount rates.
- Financial Statements: Detailed annual and quarterly financials for comprehensive analysis.
- Key Ratios: Metrics on profitability, leverage, and efficiency to assess performance.
- Dashboard and Charts: Visual representations of valuation results and underlying assumptions.
Disclaimer
All information, articles, and product details provided on this website are for general informational and educational purposes only. We do not claim any ownership over, nor do we intend to infringe upon, any trademarks, copyrights, logos, brand names, or other intellectual property mentioned or depicted on this site. Such intellectual property remains the property of its respective owners, and any references here are made solely for identification or informational purposes, without implying any affiliation, endorsement, or partnership.
We make no representations or warranties, express or implied, regarding the accuracy, completeness, or suitability of any content or products presented. Nothing on this website should be construed as legal, tax, investment, financial, medical, or other professional advice. In addition, no part of this site—including articles or product references—constitutes a solicitation, recommendation, endorsement, advertisement, or offer to buy or sell any securities, franchises, or other financial instruments, particularly in jurisdictions where such activity would be unlawful.
All content is of a general nature and may not address the specific circumstances of any individual or entity. It is not a substitute for professional advice or services. Any actions you take based on the information provided here are strictly at your own risk. You accept full responsibility for any decisions or outcomes arising from your use of this website and agree to release us from any liability in connection with your use of, or reliance upon, the content or products found herein.