
|
First Pacific Company Limited (0142.HK) DCF -Bewertung |
Fully Editable: Tailor To Your Needs In Excel Or Sheets
Professional Design: Trusted, Industry-Standard Templates
Investor-Approved Valuation Models
MAC/PC Compatible, Fully Unlocked
No Expertise Is Needed; Easy To Follow
First Pacific Company Limited (0142.HK) Bundle
Unser (0142HK) DCF-Taschenrechner wurde für die Genauigkeit entwickelt und ermöglicht es Ihnen, die Bewertung von First Pacific Company Limited mithilfe realer Finanzdaten zu bewerten und vollständige Flexibilität zu bieten, um alle wesentlichen Parameter für erweiterte Projektionen zu ändern.
What You Will Receive
- Pre-Configured Financial Model: First Pacific Company's actual data allows for accurate DCF valuation.
- Comprehensive Forecast Control: Easily modify revenue growth, profit margins, WACC, and other essential parameters.
- Real-Time Calculations: Automatic updates provide instant results as you adjust inputs.
- Professional-Grade Template: A polished Excel file crafted for high-quality valuation purposes.
- Adaptable and Reusable: Designed for versatility, suitable for repeated in-depth forecasting.
Key Features
- Customizable Forecast Inputs: Adjust essential variables such as revenue growth, EBITDA percentage, and capital expenditure.
- Instant DCF Valuation: Quickly calculates intrinsic value, net present value (NPV), and other financial metrics.
- High-Precision Outcomes: Leverages First Pacific Company Limited’s (0142HK) actual financial data for accurate valuation results.
- Effortless Scenario Analysis: Easily explore various assumptions and analyze their impact on outcomes.
- Efficiency Booster: Avoid the hassle of developing intricate valuation models from the ground up.
How It Functions
- Download: Get the ready-to-use Excel file featuring First Pacific Company Limited’s financial data.
- Customize: Modify forecasts, including revenue growth, EBITDA %, and WACC.
- Automatic Updates: The intrinsic value and NPV calculations refresh in real-time.
- Scenario Testing: Generate various projections and compare results instantly.
- Informed Decisions: Utilize the valuation insights to shape your investment approach.
Why Choose This Calculator for First Pacific Company Limited (0142HK)?
- User-Friendly Interface: Suitable for both novices and experienced users.
- Customizable Inputs: Easily adjust parameters to suit your specific analysis.
- Real-Time Valuation: Observe immediate updates to First Pacific's valuation as you change inputs.
- Pre-Loaded Data: Comes with First Pacific’s actual financial information for efficient analysis.
- Relied Upon by Experts: Favored by investors and analysts for making well-informed decisions.
Who Should Utilize This Product?
- Investors: Effectively determine the fair value of First Pacific Company Limited (0142HK) to inform investment choices.
- CFOs: Utilize a sophisticated DCF model for precise financial reporting and analysis.
- Consultants: Easily tailor the template for client valuation reports focused on First Pacific Company Limited (0142HK).
- Entrepreneurs: Discover the financial modeling techniques employed by leading companies in the industry.
- Educators: Implement it as a resource to illustrate valuation methodologies in the classroom.
Contents of the Template
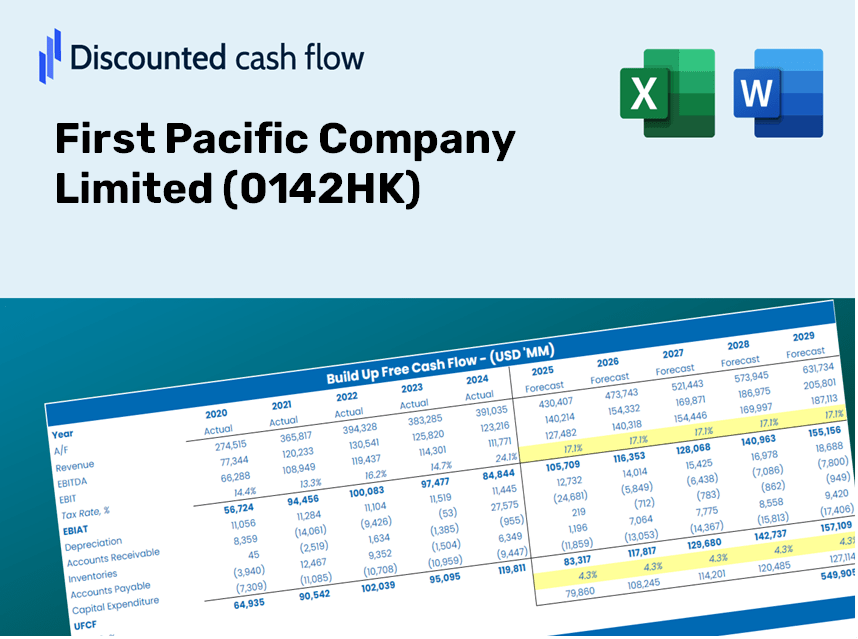
- Preloaded 0142HK Data: Historical and projected financial data, covering revenue, EBIT, and capital expenditures.
- DCF and WACC Models: Advanced sheets designed for calculating intrinsic value and the Weighted Average Cost of Capital.
- Editable Inputs: Cells highlighted in yellow for adjusting revenue growth, tax rates, and discount rates.
- Financial Statements: Detailed annual and quarterly financials for thorough analysis.
- Key Ratios: Metrics on profitability, leverage, and efficiency to assess performance.
- Dashboard and Charts: Visual representations of valuation outcomes and underlying assumptions.
Disclaimer
All information, articles, and product details provided on this website are for general informational and educational purposes only. We do not claim any ownership over, nor do we intend to infringe upon, any trademarks, copyrights, logos, brand names, or other intellectual property mentioned or depicted on this site. Such intellectual property remains the property of its respective owners, and any references here are made solely for identification or informational purposes, without implying any affiliation, endorsement, or partnership.
We make no representations or warranties, express or implied, regarding the accuracy, completeness, or suitability of any content or products presented. Nothing on this website should be construed as legal, tax, investment, financial, medical, or other professional advice. In addition, no part of this site—including articles or product references—constitutes a solicitation, recommendation, endorsement, advertisement, or offer to buy or sell any securities, franchises, or other financial instruments, particularly in jurisdictions where such activity would be unlawful.
All content is of a general nature and may not address the specific circumstances of any individual or entity. It is not a substitute for professional advice or services. Any actions you take based on the information provided here are strictly at your own risk. You accept full responsibility for any decisions or outcomes arising from your use of this website and agree to release us from any liability in connection with your use of, or reliance upon, the content or products found herein.