
|
Grand Pharmaceutical Group Limited (0512.HK) DCF -Bewertung |
Fully Editable: Tailor To Your Needs In Excel Or Sheets
Professional Design: Trusted, Industry-Standard Templates
Investor-Approved Valuation Models
MAC/PC Compatible, Fully Unlocked
No Expertise Is Needed; Easy To Follow
Grand Pharmaceutical Group Limited (0512.HK) Bundle
Entdecken Sie den finanziellen Ausblick von Grand Pharmaceutical Group Limited (0512HK) mit unserem benutzerfreundlichen DCF-Taschenrechner! Geben Sie Ihre Prognosen für Wachstum, Gewinnmargen und Ausgaben ein, um den inneren Wert der Grand Pharmaceutical Group Limited (0512HK) zu berechnen und Ihre Anlageentscheidungen zu informieren.
Discounted Cash Flow (DCF) - (USD MM)
| Year | AY1 2020 |
AY2 2021 |
AY3 2022 |
AY4 2023 |
AY5 2024 |
FY1 2025 |
FY2 2026 |
FY3 2027 |
FY4 2028 |
FY5 2029 |
|---|---|---|---|---|---|---|---|---|---|---|
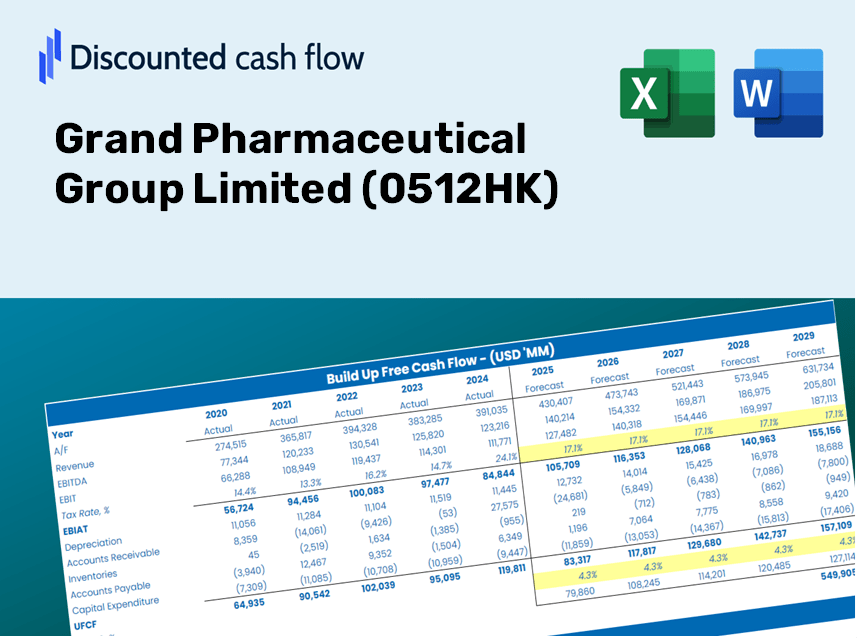
| Revenue | 6,352.9 | 8,598.0 | 9,562.3 | 10,529.6 | 11,644.9 | 13,603.1 | 15,890.5 | 18,562.6 | 21,684.0 | 25,330.3 |
| Revenue Growth, % | 0 | 35.34 | 11.22 | 10.12 | 10.59 | 16.82 | 16.82 | 16.82 | 16.82 | 16.82 |
| EBITDA | 2,414.1 | 3,104.5 | 3,093.1 | 2,966.6 | 3,387.6 | 4,454.1 | 5,203.1 | 6,078.0 | 7,100.1 | 8,294.0 |
| EBITDA, % | 38 | 36.11 | 32.35 | 28.17 | 29.09 | 32.74 | 32.74 | 32.74 | 32.74 | 32.74 |
| Depreciation | 287.1 | 339.5 | 394.9 | 392.2 | 503.7 | 561.8 | 656.2 | 766.6 | 895.5 | 1,046.0 |
| Depreciation, % | 4.52 | 3.95 | 4.13 | 3.72 | 4.33 | 4.13 | 4.13 | 4.13 | 4.13 | 4.13 |
| EBIT | 2,127.0 | 2,764.9 | 2,698.2 | 2,574.4 | 2,883.9 | 3,892.4 | 4,546.9 | 5,311.5 | 6,204.6 | 7,248.0 |
| EBIT, % | 33.48 | 32.16 | 28.22 | 24.45 | 24.77 | 28.61 | 28.61 | 28.61 | 28.61 | 28.61 |
| Total Cash | 2,388.4 | 2,873.5 | 2,484.0 | 2,474.3 | 3,140.9 | 4,011.9 | 4,686.5 | 5,474.6 | 6,395.2 | 7,470.6 |
| Total Cash, percent | .0 | .0 | .0 | .0 | .0 | .0 | .0 | .0 | .0 | .0 |
| Account Receivables | 1,716.1 | 2,149.4 | 2,206.9 | 2,250.4 | 2,786.4 | 3,275.4 | 3,826.2 | 4,469.6 | 5,221.1 | 6,099.1 |
| Account Receivables, % | 27.01 | 25 | 23.08 | 21.37 | 23.93 | 24.08 | 24.08 | 24.08 | 24.08 | 24.08 |
| Inventories | 955.3 | 1,117.2 | 1,340.5 | 1,388.6 | 1,370.6 | 1,823.0 | 2,129.5 | 2,487.6 | 2,905.9 | 3,394.6 |
| Inventories, % | 15.04 | 12.99 | 14.02 | 13.19 | 11.77 | 13.4 | 13.4 | 13.4 | 13.4 | 13.4 |
| Accounts Payable | 662.5 | 734.5 | 872.9 | 1,330.4 | 1,217.4 | 1,392.6 | 1,626.8 | 1,900.4 | 2,219.9 | 2,593.2 |
| Accounts Payable, % | 10.43 | 8.54 | 9.13 | 12.63 | 10.45 | 10.24 | 10.24 | 10.24 | 10.24 | 10.24 |
| Capital Expenditure | -467.2 | -627.4 | -1,671.3 | -497.7 | -621.9 | -1,148.0 | -1,341.1 | -1,566.6 | -1,830.0 | -2,137.7 |
| Capital Expenditure, % | -7.35 | -7.3 | -17.48 | -4.73 | -5.34 | -8.44 | -8.44 | -8.44 | -8.44 | -8.44 |
| Tax Rate, % | 13.46 | 13.46 | 13.46 | 13.46 | 13.46 | 13.46 | 13.46 | 13.46 | 13.46 | 13.46 |
| EBITAT | 1,838.9 | 2,384.5 | 2,229.2 | 2,064.6 | 2,495.7 | 3,285.5 | 3,838.0 | 4,483.4 | 5,237.3 | 6,118.0 |
| Depreciation | ||||||||||
| Changes in Account Receivables | ||||||||||
| Changes in Inventories | ||||||||||
| Changes in Accounts Payable | ||||||||||
| Capital Expenditure | ||||||||||
| UFCF | -350.3 | 1,573.5 | 810.4 | 2,325.0 | 1,746.5 | 1,933.2 | 2,530.0 | 2,955.5 | 3,452.5 | 4,033.0 |
| WACC, % | 7.16 | 7.16 | 7.14 | 7.13 | 7.17 | 7.15 | 7.15 | 7.15 | 7.15 | 7.15 |
| PV UFCF | ||||||||||
| SUM PV UFCF | 11,883.4 | |||||||||
| Long Term Growth Rate, % | 2.00 | |||||||||
| Free cash flow (T + 1) | 4,114 | |||||||||
| Terminal Value | 79,816 | |||||||||
| Present Terminal Value | 56,500 | |||||||||
| Enterprise Value | 68,384 | |||||||||
| Net Debt | 3,102 | |||||||||
| Equity Value | 65,282 | |||||||||
| Diluted Shares Outstanding, MM | 3,502 | |||||||||
| Equity Value Per Share | 18.64 |
What You Will Receive
- Authentic Grand Pharmaceutical Data: Preloaded financials – encompassing revenue to EBIT – grounded in both actual and projected figures.
- Comprehensive Customization: Modify all vital parameters (yellow cells) such as WACC, growth %, and tax rates.
- Immediate Valuation Adjustments: Automatic recalculations to assess the effects of changes on the fair value of Grand Pharmaceutical Group Limited (0512HK).
- Flexible Excel Template: Designed for quick modifications, scenario analysis, and thorough projections.
- Efficient and Precise: Eliminate the need to construct models from the ground up while ensuring accuracy and adaptability.
Key Features
- Comprehensive 0512HK Data: Pre-loaded with Grand Pharmaceutical Group Limited's historical financial information and future growth projections.
- Completely Customizable Variables: Modify revenue growth rates, profit margins, WACC, tax percentages, and capital expenditure plans.
- Adaptive Valuation Model: Automatically refreshes the Net Present Value (NPV) and intrinsic value based on your input adjustments.
- Scenario Analysis: Generate various forecasting scenarios to evaluate different valuation possibilities.
- Intuitive Interface: User-friendly and systematically designed for both industry veterans and newcomers.
How It Works
- Download: Obtain the ready-to-use Excel file containing Grand Pharmaceutical Group Limited’s (0512HK) financial data.
- Customize: Modify forecasts such as revenue growth, EBITDA %, and WACC as per your analysis.
- Update Automatically: Enjoy real-time updates on intrinsic value and NPV calculations.
- Test Scenarios: Develop various projections and compare results effortlessly.
- Make Decisions: Leverage the valuation insights to refine your investment strategy.
Why Opt for the Grand Pharmaceutical Group Limited Calculator?
- Precision: Utilizes authentic Grand Pharmaceutical financial data to ensure accuracy.
- Versatility: Crafted to allow users the freedom to test and adjust inputs as needed.
- Efficiency: Eliminate the complexities of creating a DCF model from the ground up.
- Expert-Level: Designed with the meticulous standards and usability expected from top financial professionals.
- Intuitive: Simple to navigate, making it accessible for users without extensive financial modeling skills.
Who Can Benefit from This Product?
- Investors: Make informed decisions by accurately estimating the fair value of Grand Pharmaceutical Group Limited (0512HK).
- CFOs: Utilize a professional-grade DCF model for comprehensive financial reporting and analysis.
- Consultants: Easily customize the template for client valuation reports.
- Entrepreneurs: Discover financial modeling techniques employed by leading companies in the industry.
- Educators: Implement this resource as a teaching aid to illustrate valuation methodologies.
Contents of the Template
- Pre-Filled DCF Model: Grand Pharmaceutical’s financial data preloaded for immediate application.
- WACC Calculator: Comprehensive calculations for the Weighted Average Cost of Capital.
- Financial Ratios: Assess Grand Pharmaceutical's profitability, leverage, and operational efficiency.
- Editable Inputs: Modify assumptions such as growth rates, margins, and CAPEX to suit your analysis.
- Financial Statements: Annual and quarterly reports to facilitate in-depth evaluation.
- Interactive Dashboard: Effortlessly visualize key valuation metrics and outcomes.
Disclaimer
All information, articles, and product details provided on this website are for general informational and educational purposes only. We do not claim any ownership over, nor do we intend to infringe upon, any trademarks, copyrights, logos, brand names, or other intellectual property mentioned or depicted on this site. Such intellectual property remains the property of its respective owners, and any references here are made solely for identification or informational purposes, without implying any affiliation, endorsement, or partnership.
We make no representations or warranties, express or implied, regarding the accuracy, completeness, or suitability of any content or products presented. Nothing on this website should be construed as legal, tax, investment, financial, medical, or other professional advice. In addition, no part of this site—including articles or product references—constitutes a solicitation, recommendation, endorsement, advertisement, or offer to buy or sell any securities, franchises, or other financial instruments, particularly in jurisdictions where such activity would be unlawful.
All content is of a general nature and may not address the specific circumstances of any individual or entity. It is not a substitute for professional advice or services. Any actions you take based on the information provided here are strictly at your own risk. You accept full responsibility for any decisions or outcomes arising from your use of this website and agree to release us from any liability in connection with your use of, or reliance upon, the content or products found herein.