
|
Fufeng Group Limited (0546.HK) DCF -Bewertung |
Fully Editable: Tailor To Your Needs In Excel Or Sheets
Professional Design: Trusted, Industry-Standard Templates
Investor-Approved Valuation Models
MAC/PC Compatible, Fully Unlocked
No Expertise Is Needed; Easy To Follow
Fufeng Group Limited (0546.HK) Bundle
Entdecken Sie den wahren Wert der Fufeng Group Limited (0546HK) mit unserem fortschrittlichen DCF -Taschenrechner! Passen Sie die wichtigsten Annahmen an, erkunden Sie verschiedene Szenarien und bewerten Sie, wie sich Änderungen auf die Bewertung der Fufeng Group Limited (0546HK) auswirken - alles innerhalb einer einzelnen Excel -Vorlage.
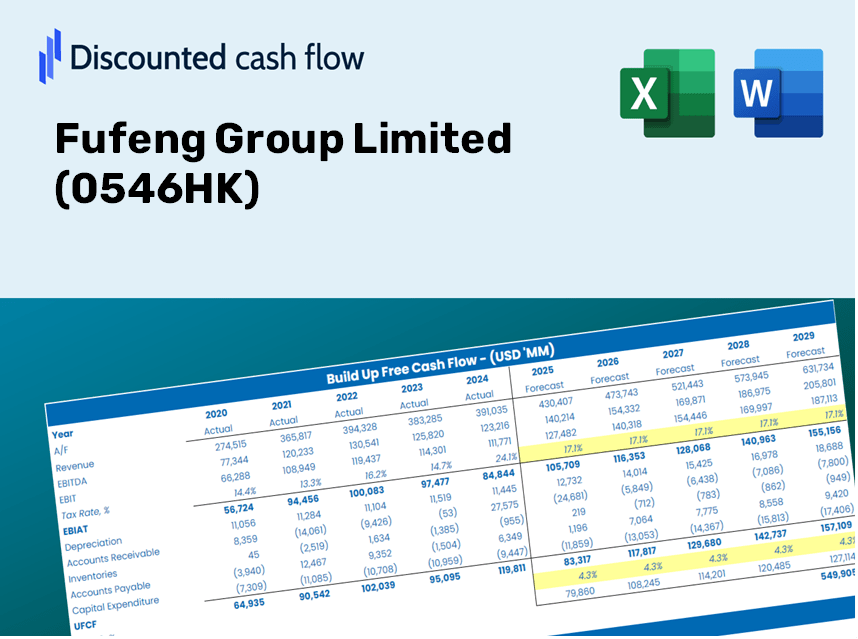
Discounted Cash Flow (DCF) - (USD MM)
| Year | AY1 2020 |
AY2 2021 |
AY3 2022 |
AY4 2023 |
AY5 2024 |
FY1 2025 |
FY2 2026 |
FY3 2027 |
FY4 2028 |
FY5 2029 |
|---|---|---|---|---|---|---|---|---|---|---|
| Revenue | 18,255.2 | 23,558.8 | 30,049.9 | 30,632.0 | 30,359.1 | 34,734.7 | 39,741.0 | 45,468.8 | 52,022.1 | 59,520.0 |
| Revenue Growth, % | 0 | 29.05 | 27.55 | 1.94 | -0.89108 | 14.41 | 14.41 | 14.41 | 14.41 | 14.41 |
| EBITDA | 2,305.6 | 3,165.1 | 6,844.8 | 4,892.2 | 3,760.7 | 5,363.1 | 6,136.1 | 7,020.5 | 8,032.3 | 9,190.0 |
| EBITDA, % | 12.63 | 13.43 | 22.78 | 15.97 | 12.39 | 15.44 | 15.44 | 15.44 | 15.44 | 15.44 |
| Depreciation | 1,343.4 | 1,333.2 | 1,268.0 | 1,197.6 | 1,197.6 | 1,743.2 | 1,994.4 | 2,281.8 | 2,610.7 | 2,987.0 |
| Depreciation, % | 7.36 | 5.66 | 4.22 | 3.91 | 3.94 | 5.02 | 5.02 | 5.02 | 5.02 | 5.02 |
| EBIT | 962.3 | 1,831.8 | 5,576.7 | 3,694.6 | 2,563.1 | 3,620.0 | 4,141.7 | 4,738.6 | 5,421.6 | 6,203.0 |
| EBIT, % | 5.27 | 7.78 | 18.56 | 12.06 | 8.44 | 10.42 | 10.42 | 10.42 | 10.42 | 10.42 |
| Total Cash | 1,384.4 | 3,921.6 | 7,746.7 | 3,097.6 | 10,968.6 | 6,686.5 | 7,650.2 | 8,752.8 | 10,014.4 | 11,457.7 |
| Total Cash, percent | .0 | .0 | .0 | .0 | .0 | .0 | .0 | .0 | .0 | .0 |
| Account Receivables | 1,445.7 | 1,945.3 | 1,160.8 | 1,147.3 | 1,189.1 | 1,924.4 | 2,201.8 | 2,519.1 | 2,882.2 | 3,297.6 |
| Account Receivables, % | 7.92 | 8.26 | 3.86 | 3.75 | 3.92 | 5.54 | 5.54 | 5.54 | 5.54 | 5.54 |
| Inventories | 4,135.7 | 5,023.5 | 6,394.4 | 6,697.2 | 6,599.9 | 7,562.4 | 8,652.4 | 9,899.4 | 11,326.2 | 12,958.7 |
| Inventories, % | 22.65 | 21.32 | 21.28 | 21.86 | 21.74 | 21.77 | 21.77 | 21.77 | 21.77 | 21.77 |
| Accounts Payable | 1,366.1 | 1,690.8 | 1,601.9 | 1,543.6 | 2,158.3 | 2,232.7 | 2,554.5 | 2,922.7 | 3,343.9 | 3,825.9 |
| Accounts Payable, % | 7.48 | 7.18 | 5.33 | 5.04 | 7.11 | 6.43 | 6.43 | 6.43 | 6.43 | 6.43 |
| Capital Expenditure | -1,081.3 | -544.6 | -1,080.7 | -2,541.4 | -1,335.9 | -1,703.9 | -1,949.5 | -2,230.5 | -2,552.0 | -2,919.8 |
| Capital Expenditure, % | -5.92 | -2.31 | -3.6 | -8.3 | -4.4 | -4.91 | -4.91 | -4.91 | -4.91 | -4.91 |
| Tax Rate, % | 18.49 | 18.49 | 18.49 | 18.49 | 18.49 | 18.49 | 18.49 | 18.49 | 18.49 | 18.49 |
| EBITAT | 786.5 | 1,547.5 | 4,430.2 | 3,017.0 | 2,089.1 | 2,959.8 | 3,386.4 | 3,874.5 | 4,433.0 | 5,071.9 |
| Depreciation | ||||||||||
| Changes in Account Receivables | ||||||||||
| Changes in Inventories | ||||||||||
| Changes in Accounts Payable | ||||||||||
| Capital Expenditure | ||||||||||
| UFCF | -3,166.6 | 1,273.5 | 3,942.1 | 1,325.7 | 2,621.0 | 1,375.7 | 2,385.8 | 2,729.6 | 3,123.1 | 3,573.2 |
| WACC, % | 3.97 | 4.01 | 3.94 | 3.97 | 3.97 | 3.97 | 3.97 | 3.97 | 3.97 | 3.97 |
| PV UFCF | ||||||||||
| SUM PV UFCF | 11,571.4 | |||||||||
| Long Term Growth Rate, % | 2.00 | |||||||||
| Free cash flow (T + 1) | 3,645 | |||||||||
| Terminal Value | 184,663 | |||||||||
| Present Terminal Value | 151,972 | |||||||||
| Enterprise Value | 163,543 | |||||||||
| Net Debt | 1,602 | |||||||||
| Equity Value | 161,942 | |||||||||
| Diluted Shares Outstanding, MM | 2,518 | |||||||||
| Equity Value Per Share | 64.32 |
Benefits You Will Receive
- Pre-Filled Financial Model: Utilize Fufeng Group Limited’s actual data for accurate DCF valuation.
- Comprehensive Forecast Control: Modify revenue growth, profit margins, WACC, and other essential factors.
- Immediate Calculations: Automatic updates ensure you view results in real-time as adjustments are made.
- Investor-Ready Template: A polished Excel file crafted for high-quality valuation presentations.
- Customizable and Reusable: Designed with flexibility in mind, suitable for multiple detailed forecasts.
Key Features
- 🔍 Real-Life Fufeng Financials: Pre-filled historical and projected data for Fufeng Group Limited (0546HK).
- ✏️ Fully Customizable Inputs: Adjust all critical parameters (yellow cells) such as WACC, growth %, and tax rates.
- 📊 Professional DCF Valuation: Integrated formulas calculate Fufeng’s intrinsic value using the Discounted Cash Flow method.
- ⚡ Instant Results: View Fufeng’s valuation immediately after making adjustments.
- Scenario Analysis: Explore and compare various financial assumptions side-by-side.
How It Operates
- Download: Obtain the pre-formatted Excel spreadsheet featuring Fufeng Group Limited’s financial data (0546HK).
- Customize: Modify forecasts such as revenue growth, EBITDA percentage, and WACC as needed.
- Update Automatically: Enjoy real-time updates on intrinsic value and NPV calculations.
- Test Scenarios: Develop various projections and instantly compare different outcomes.
- Make Decisions: Leverage the valuation results to inform your investment strategy.
Why Choose the Fufeng Group Limited (0546HK) Calculator?
- Time-Efficient: Skip the hassle of building a DCF model from the ground up – it’s ready for immediate use.
- Enhanced Precision: Access to accurate financial data and formulas minimizes valuation errors.
- Completely Customizable: Adjust the model to align with your specific assumptions and forecasts.
- Intuitive Design: User-friendly charts and outputs simplify result interpretation.
- Endorsed by Professionals: Created for industry experts who prioritize accuracy and practicality.
Who Should Benefit from This Product?
- Individual Investors: Gain the insights needed to make informed decisions regarding the purchase or sale of Fufeng Group Limited (0546HK) shares.
- Financial Analysts: Enhance your valuation workflows with pre-built financial models tailored for Fufeng Group Limited (0546HK).
- Consultants: Provide clients with precise and timely valuation insights related to Fufeng Group Limited (0546HK).
- Business Owners: Learn how large enterprises like Fufeng Group Limited (0546HK) are valued to inform your own strategic planning.
- Finance Students: Acquire practical valuation skills using real-world data and case studies involving Fufeng Group Limited (0546HK).
Contents of the Template
- Pre-Filled DCF Model: Fufeng Group Limited’s (0546HK) financial data preloaded for instant analysis.
- WACC Calculator: Comprehensive calculations for Weighted Average Cost of Capital.
- Financial Ratios: Assess Fufeng Group Limited’s (0546HK) profitability, leverage, and operational efficiency.
- Editable Inputs: Adjust assumptions like growth rates, profit margins, and CAPEX to tailor to your needs.
- Financial Statements: Access annual and quarterly reports for in-depth financial analysis.
- Interactive Dashboard: Visualize essential valuation metrics and outcomes with ease.
Disclaimer
All information, articles, and product details provided on this website are for general informational and educational purposes only. We do not claim any ownership over, nor do we intend to infringe upon, any trademarks, copyrights, logos, brand names, or other intellectual property mentioned or depicted on this site. Such intellectual property remains the property of its respective owners, and any references here are made solely for identification or informational purposes, without implying any affiliation, endorsement, or partnership.
We make no representations or warranties, express or implied, regarding the accuracy, completeness, or suitability of any content or products presented. Nothing on this website should be construed as legal, tax, investment, financial, medical, or other professional advice. In addition, no part of this site—including articles or product references—constitutes a solicitation, recommendation, endorsement, advertisement, or offer to buy or sell any securities, franchises, or other financial instruments, particularly in jurisdictions where such activity would be unlawful.
All content is of a general nature and may not address the specific circumstances of any individual or entity. It is not a substitute for professional advice or services. Any actions you take based on the information provided here are strictly at your own risk. You accept full responsibility for any decisions or outcomes arising from your use of this website and agree to release us from any liability in connection with your use of, or reliance upon, the content or products found herein.