
|
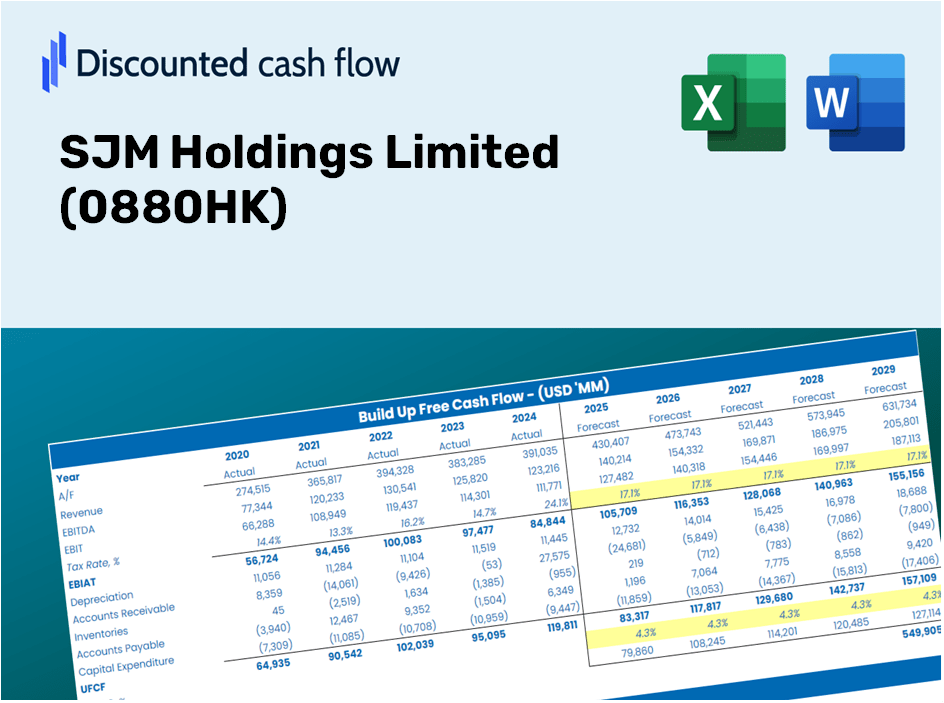
SJM Holdings Limited (0880.HK) DCF -Bewertung |
Fully Editable: Tailor To Your Needs In Excel Or Sheets
Professional Design: Trusted, Industry-Standard Templates
Investor-Approved Valuation Models
MAC/PC Compatible, Fully Unlocked
No Expertise Is Needed; Easy To Follow
SJM Holdings Limited (0880.HK) Bundle
Entdecken Sie den finanziellen Ausblick von SJM Holdings Limited (0880HK) mit unserem benutzerfreundlichen DCF-Taschenrechner! Geben Sie Ihre Prognosen für Wachstum, Margen und Ausgaben ein, um den inneren Wert von SJM Holdings Limited (0880HK) zu berechnen und Ihre Anlagestrategie zu verfeinern.
Discounted Cash Flow (DCF) - (USD MM)
| Year | AY1 2020 |
AY2 2021 |
AY3 2022 |
AY4 2023 |
AY5 2024 |
FY1 2025 |
FY2 2026 |
FY3 2027 |
FY4 2028 |
FY5 2029 |
|---|---|---|---|---|---|---|---|---|---|---|
| Revenue | 4,138.5 | 5,890.2 | 3,998.0 | 13,136.6 | 17,240.6 | 23,337.0 | 31,589.2 | 42,759.4 | 57,879.5 | 78,346.1 |
| Revenue Growth, % | 0 | 42.33 | -32.12 | 228.58 | 31.24 | 35.36 | 35.36 | 35.36 | 35.36 | 35.36 |
| EBITDA | -2,137.0 | -2,577.2 | -4,770.0 | 1,932.0 | 3,924.6 | -7,370.8 | -9,977.2 | -13,505.2 | -18,280.7 | -24,744.9 |
| EBITDA, % | -51.64 | -43.75 | -119.31 | 14.71 | 22.76 | -31.58 | -31.58 | -31.58 | -31.58 | -31.58 |
| Depreciation | 1,000.2 | 1,256.2 | 1,895.3 | 1,839.5 | 1,888.7 | 5,501.0 | 7,446.1 | 10,079.2 | 13,643.2 | 18,467.6 |
| Depreciation, % | 24.17 | 21.33 | 47.41 | 14 | 10.95 | 23.57 | 23.57 | 23.57 | 23.57 | 23.57 |
| EBIT | -3,137.2 | -3,833.4 | -6,665.3 | 92.5 | 2,035.9 | -10,659.1 | -14,428.3 | -19,530.2 | -26,436.3 | -35,784.3 |
| EBIT, % | -75.81 | -65.08 | -166.72 | 0.70414 | 11.81 | -45.67 | -45.67 | -45.67 | -45.67 | -45.67 |
| Total Cash | 6,125.8 | 3,201.4 | 6,855.5 | 3,541.7 | 2,207.9 | 13,727.7 | 18,581.9 | 25,152.6 | 34,046.8 | 46,086.0 |
| Total Cash, percent | .0 | .0 | .0 | .0 | .0 | .0 | .0 | .0 | .0 | .0 |
| Account Receivables | 625.1 | 63.2 | 120.4 | 202.8 | 367.3 | 1,067.1 | 1,444.5 | 1,955.2 | 2,646.6 | 3,582.5 |
| Account Receivables, % | 15.1 | 1.07 | 3.01 | 1.54 | 2.13 | 4.57 | 4.57 | 4.57 | 4.57 | 4.57 |
| Inventories | 121.7 | 151.3 | 146.7 | 147.9 | 148.1 | 521.0 | 705.3 | 954.7 | 1,292.3 | 1,749.2 |
| Inventories, % | 2.94 | 2.57 | 3.67 | 1.13 | 0.85902 | 2.23 | 2.23 | 2.23 | 2.23 | 2.23 |
| Accounts Payable | 307.6 | 263.4 | 86.6 | 348.6 | 395.6 | 887.7 | 1,201.6 | 1,626.5 | 2,201.6 | 2,980.1 |
| Accounts Payable, % | 7.43 | 4.47 | 2.17 | 2.65 | 2.29 | 3.8 | 3.8 | 3.8 | 3.8 | 3.8 |
| Capital Expenditure | -3,447.6 | -1,445.9 | -1,077.4 | -1,688.2 | -1,754.1 | -7,366.4 | -9,971.2 | -13,497.2 | -18,269.9 | -24,730.3 |
| Capital Expenditure, % | -83.31 | -24.55 | -26.95 | -12.85 | -10.17 | -31.57 | -31.57 | -31.57 | -31.57 | -31.57 |
| Tax Rate, % | 97.98 | 97.98 | 97.98 | 97.98 | 97.98 | 97.98 | 97.98 | 97.98 | 97.98 | 97.98 |
| EBITAT | -3,010.3 | -3,803.1 | -6,674.6 | 101.1 | 41.0 | -8,467.2 | -11,461.2 | -15,514.0 | -20,999.9 | -28,425.7 |
| Depreciation | ||||||||||
| Changes in Account Receivables | ||||||||||
| Changes in Inventories | ||||||||||
| Changes in Accounts Payable | ||||||||||
| Capital Expenditure | ||||||||||
| UFCF | -5,896.9 | -3,504.7 | -6,086.1 | 430.8 | 57.9 | -10,913.3 | -14,234.0 | -19,267.3 | -26,080.4 | -35,302.6 |
| WACC, % | 6.9 | 7.03 | 7.06 | 7.06 | 3.17 | 6.24 | 6.24 | 6.24 | 6.24 | 6.24 |
| PV UFCF | ||||||||||
| SUM PV UFCF | -85,497.9 | |||||||||
| Long Term Growth Rate, % | 2.00 | |||||||||
| Free cash flow (T + 1) | -36,009 | |||||||||
| Terminal Value | -848,618 | |||||||||
| Present Terminal Value | -626,911 | |||||||||
| Enterprise Value | -712,409 | |||||||||
| Net Debt | 25,471 | |||||||||
| Equity Value | -737,880 | |||||||||
| Diluted Shares Outstanding, MM | 7,102 | |||||||||
| Equity Value Per Share | -103.90 |
What You Will Receive
- Comprehensive Financial Model: Leverage SJM Holdings Limited's (0880HK) actual data for accurate DCF valuation.
- Complete Forecast Flexibility: Modify revenue growth, profit margins, WACC, and other critical factors.
- Real-Time Calculations: Automatic updates ensure you see the impact of your adjustments instantly.
- Professional-Grade Template: An expertly crafted Excel file optimized for investment valuation.
- Adaptable and Reusable: Built for versatility, allowing you to conduct in-depth forecasts repeatedly.
Key Features
- 🔍 Real-Life SJM Financials: Pre-filled historical and projected data for SJM Holdings Limited (0880HK).
- ✏️ Fully Customizable Inputs: Modify all essential parameters (yellow cells) such as WACC, growth %, and tax rates.
- 📊 Professional DCF Valuation: Integrated formulas to assess SJM's intrinsic value through the Discounted Cash Flow method.
- ⚡ Instant Results: Visualize SJM's valuation immediately upon making adjustments.
- Scenario Analysis: Evaluate and compare outcomes for various financial assumptions side-by-side.
How It Works
- 1. Open the Template: Download and access the Excel file containing SJM Holdings Limited’s (0880HK) preloaded data.
- 2. Edit Assumptions: Modify key inputs such as growth rates, WACC, and capital expenditures to fit your analysis.
- 3. View Results Instantly: The DCF model automatically computes the intrinsic value and NPV for SJM Holdings Limited (0880HK).
- 4. Test Scenarios: Evaluate multiple forecasts to examine various valuation outcomes for SJM Holdings Limited (0880HK).
- 5. Use with Confidence: Deliver professional valuation insights to back your investment decisions regarding SJM Holdings Limited (0880HK).
Why Opt for This Calculator?
- Designed for Experts: A sophisticated instrument tailored for analysts, CFOs, and consultants.
- Accurate Financial Data: Historical and projected financials of SJM Holdings Limited (0880HK) preloaded for precision.
- Forecast Simulation: Easily test various scenarios and assumptions.
- Concise Results: Automatically computes intrinsic value, NPV, and essential metrics.
- User-Friendly: Comprehensive step-by-step guidance to navigate the process effortlessly.
Who Should Consider SJM Holdings Limited (0880HK)?
- Finance Students: Discover valuation strategies and practice them with actual market data.
- Academics: Utilize established financial models in your studies or academic research.
- Investors: Challenge your perspectives and assess valuation scenarios for SJM Holdings Limited (0880HK).
- Analysts: Enhance your efficiency with a ready-to-use, customizable DCF model specifically for SJM Holdings Limited (0880HK).
- Small Business Owners: Understand the analytical methods used for evaluating large public firms like SJM Holdings Limited (0880HK).
Contents of the Template
- Historical Data: Comprises SJM Holdings Limited's past financial records and foundational forecasts.
- DCF and Levered DCF Models: Comprehensive templates designed to determine the intrinsic value of SJM Holdings Limited.
- WACC Sheet: Built-in calculations for the Weighted Average Cost of Capital.
- Editable Inputs: Adjust key variables such as growth rates, EBITDA %, and CAPEX estimates.
- Quarterly and Annual Statements: An exhaustive analysis of SJM Holdings Limited's financial performance.
- Interactive Dashboard: Dynamically visualize valuation outcomes and forecasts.
Disclaimer
All information, articles, and product details provided on this website are for general informational and educational purposes only. We do not claim any ownership over, nor do we intend to infringe upon, any trademarks, copyrights, logos, brand names, or other intellectual property mentioned or depicted on this site. Such intellectual property remains the property of its respective owners, and any references here are made solely for identification or informational purposes, without implying any affiliation, endorsement, or partnership.
We make no representations or warranties, express or implied, regarding the accuracy, completeness, or suitability of any content or products presented. Nothing on this website should be construed as legal, tax, investment, financial, medical, or other professional advice. In addition, no part of this site—including articles or product references—constitutes a solicitation, recommendation, endorsement, advertisement, or offer to buy or sell any securities, franchises, or other financial instruments, particularly in jurisdictions where such activity would be unlawful.
All content is of a general nature and may not address the specific circumstances of any individual or entity. It is not a substitute for professional advice or services. Any actions you take based on the information provided here are strictly at your own risk. You accept full responsibility for any decisions or outcomes arising from your use of this website and agree to release us from any liability in connection with your use of, or reliance upon, the content or products found herein.