
|
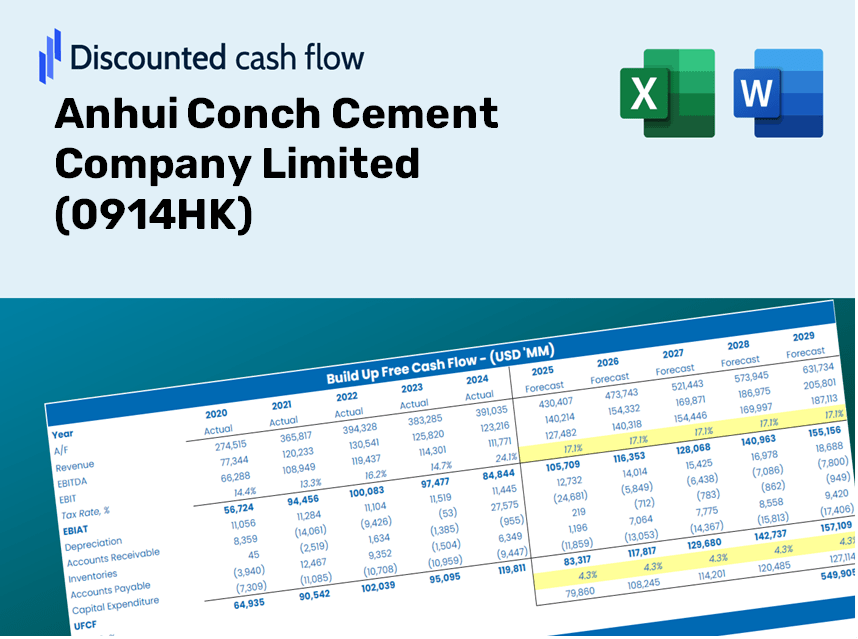
Anhui Conch Cement Company Limited (0914.HK) DCF -Bewertung |
Fully Editable: Tailor To Your Needs In Excel Or Sheets
Professional Design: Trusted, Industry-Standard Templates
Investor-Approved Valuation Models
MAC/PC Compatible, Fully Unlocked
No Expertise Is Needed; Easy To Follow
Anhui Conch Cement Company Limited (0914.HK) Bundle
Stürzen Sie Ihre Analyse und verbessern Sie die Präzision mit unserem DCF -Taschenrechner (0914HK)! Mithilfe realer Daten von Anhui Conch Cement Company Limited und anpassbaren Annahmen ermöglicht Ihnen dieses Tool, wie ein erfahrener Investor prognostizieren, bewerten und bewerten (0914HK).
What You Will Receive
- Authentic 0914HK Financial Data: Includes comprehensive historical and forecasted data for accurate analysis.
- Customizable Template: Effortlessly adjust critical inputs such as revenue growth, WACC, and EBITDA percentage.
- Real-Time Calculations: Instantly view updates to Anhui Conch Cement's intrinsic value as you make adjustments.
- Expert Valuation Tool: Tailored for investors, analysts, and consultants who require reliable DCF outcomes.
- Intuitive Interface: Features a straightforward layout and clear guidance suitable for all skill levels.
Key Features
- 🔍 Real-Life 0914HK Financials: Pre-filled historical and projected data for Anhui Conch Cement Company Limited.
- ✏️ Fully Customizable Inputs: Adjust all critical parameters (yellow cells) such as WACC, growth %, and tax rates.
- 📊 Professional DCF Valuation: Built-in formulas calculate Anhui Conch Cement's intrinsic value using the Discounted Cash Flow method.
- ⚡ Instant Results: Visualize Anhui Conch Cement's valuation instantly after making adjustments.
- Scenario Analysis: Test and compare outcomes for various financial assumptions side-by-side.
How It Functions
- Step 1: Download the Excel sheet.
- Step 2: Examine the pre-filled data for Anhui Conch Cement Company Limited (0914HK) (historical and forecasted).
- Step 3: Modify key assumptions (highlighted in yellow) according to your findings.
- Step 4: Observe the automatic recalculations reflecting the intrinsic value of Anhui Conch Cement Company Limited (0914HK).
- Step 5: Utilize the results for investment decisions or reporting purposes.
Why Opt for This Calculator?
- All-in-One Solution: Combines DCF, WACC, and financial ratio analyses for thorough evaluations.
- Flexible Inputs: Modify yellow-highlighted cells to explore various scenarios.
- In-Depth Analysis: Automatically computes the intrinsic value and Net Present Value of Anhui Conch Cement Company Limited (0914HK).
- Preloaded Information: Historical and projected data provide a solid foundation for analysis.
- Industry Standard: Perfect for financial analysts, investors, and business advisors.
Who Can Benefit from This Product?
- Individual Investors: Gain clarity in making decisions about buying or selling Anhui Conch Cement shares (0914HK).
- Financial Analysts: Enhance valuation methodologies with comprehensive financial models tailored for Anhui Conch Cement (0914HK).
- Consultants: Provide clients with precise valuation insights on Anhui Conch Cement (0914HK) in a timely manner.
- Business Owners: Learn how large firms like Anhui Conch Cement (0914HK) are valued to inform your strategic planning.
- Finance Students: Explore valuation principles using real-time data and applicable case studies from Anhui Conch Cement (0914HK).
Contents of the Template
- Pre-Filled Data: Contains Anhui Conch Cement Company Limited's historical financial performance and projections.
- Discounted Cash Flow Model: An editable DCF valuation model featuring automatic calculations.
- Weighted Average Cost of Capital (WACC): A specific worksheet for computing WACC based on user-defined inputs.
- Key Financial Ratios: Insights into Anhui Conch's profitability, operational efficiency, and financial leverage.
- Customizable Inputs: Easily modify revenue growth rates, profit margins, and tax rates.
- Clear Dashboard: Visualizations and tables that summarize critical valuation insights.
Disclaimer
All information, articles, and product details provided on this website are for general informational and educational purposes only. We do not claim any ownership over, nor do we intend to infringe upon, any trademarks, copyrights, logos, brand names, or other intellectual property mentioned or depicted on this site. Such intellectual property remains the property of its respective owners, and any references here are made solely for identification or informational purposes, without implying any affiliation, endorsement, or partnership.
We make no representations or warranties, express or implied, regarding the accuracy, completeness, or suitability of any content or products presented. Nothing on this website should be construed as legal, tax, investment, financial, medical, or other professional advice. In addition, no part of this site—including articles or product references—constitutes a solicitation, recommendation, endorsement, advertisement, or offer to buy or sell any securities, franchises, or other financial instruments, particularly in jurisdictions where such activity would be unlawful.
All content is of a general nature and may not address the specific circumstances of any individual or entity. It is not a substitute for professional advice or services. Any actions you take based on the information provided here are strictly at your own risk. You accept full responsibility for any decisions or outcomes arising from your use of this website and agree to release us from any liability in connection with your use of, or reliance upon, the content or products found herein.