
|
Anhui Expressway Company Limited (0995.HK) DCF -Bewertung |
Fully Editable: Tailor To Your Needs In Excel Or Sheets
Professional Design: Trusted, Industry-Standard Templates
Investor-Approved Valuation Models
MAC/PC Compatible, Fully Unlocked
No Expertise Is Needed; Easy To Follow
Anhui Expressway Company Limited (0995.HK) Bundle
Verbessern Sie Ihre Anlagestrategien mit dem DCF -Taschenrechner (0995HK)! Erforschen Sie echte Finanzdaten für Anhui Expressway Company Limited, stellen Sie Wachstumsprognosen und -kosten an und beobachten Sie sofort, wie sich diese Modifikationen auf den inneren Wert von (0995HK) auswirken.
Your Benefits
- Customizable Excel Template: A fully adaptable Excel-based DCF Calculator featuring pre-populated financial data for Anhui Expressway Company Limited (0995HK).
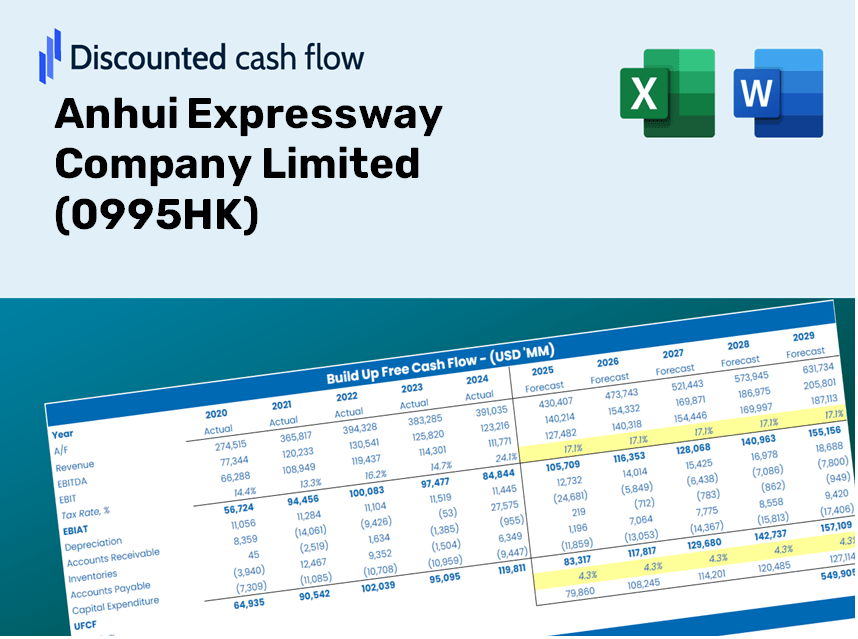
- Comprehensive Data: Historical performance metrics and forward-looking projections (highlighted in the yellow cells).
- Flexible Forecasting: Adjust key assumptions such as revenue growth, EBITDA percentages, and WACC to fit your analysis.
- Instant Calculations: Immediately observe how your inputs influence the valuation of Anhui Expressway Company Limited (0995HK).
- Professional Resource: Designed for investors, CFOs, consultants, and financial analysts seeking in-depth insights.
- User-Friendly Interface: Organized for straightforward navigation and ease of use, complete with step-by-step guidance.
Key Features
- 🔍 Real-Life 0995HK Financials: Access pre-filled historical and projected data for Anhui Expressway Company Limited.
- ✏️ Fully Customizable Inputs: Modify all essential parameters (yellow cells) such as WACC, growth %, and tax rates to suit your analysis.
- 📊 Professional DCF Valuation: Utilize built-in formulas to determine the intrinsic value of Anhui Expressway using the Discounted Cash Flow method.
- ⚡ Instant Results: See immediate visualization of Anhui Expressway’s valuation upon making adjustments.
- Scenario Analysis: Examine and compare results for different financial assumptions side-by-side.
How It Functions
- Step 1: Download the pre-built Excel template featuring data for Anhui Expressway Company Limited (0995HK).
- Step 2: Review the pre-filled sheets to familiarize yourself with the essential metrics.
- Step 3: Modify forecasts and assumptions in the editable yellow cells (WACC, growth, margins).
- Step 4: Instantly view recalculated results, including the intrinsic value of Anhui Expressway Company Limited (0995HK).
- Step 5: Make informed investment choices or generate reports based on the outputs.
Why Choose This Calculator for Anhui Expressway Company Limited (0995HK)?
- Reliable Data: Leverage authentic Anhui Expressway financials for trustworthy valuation outcomes.
- Flexible Adjustments: Tailor critical inputs such as growth rates, WACC, and tax rates to align with your forecasts.
- Efficient: Pre-configured calculations save you the hassle of building from the ground up.
- Expert-Quality Tool: Crafted for investors, analysts, and consultants specializing in the transportation sector.
- Easy to Use: User-friendly interface and clear guidance ensure accessibility for all skill levels.
Who Should Consider This Product?
- Individual Investors: Make well-informed choices regarding the purchase or sale of Anhui Expressway Company Limited (0995HK) shares.
- Financial Analysts: Enhance valuation methods with comprehensive financial models tailored for Anhui Expressway Company Limited (0995HK).
- Consultants: Provide clients with accurate and timely valuation insights related to Anhui Expressway Company Limited (0995HK).
- Business Owners: Gain insights into the valuation strategies of major companies like Anhui Expressway Company Limited (0995HK) to inform your own business tactics.
- Finance Students: Acquire practical knowledge in valuation techniques by analyzing real-world scenarios involving Anhui Expressway Company Limited (0995HK).
Contents of the Template
- Preloaded 0995HK Data: Historical and forecasted financial metrics, encompassing revenue, EBIT, and capital expenditures.
- DCF and WACC Models: Advanced templates for assessing intrinsic value and calculating the Weighted Average Cost of Capital.
- Customizable Inputs: Cells highlighted in yellow for modifying revenue growth, tax rates, and discount rates.
- Financial Statements: Detailed annual and quarterly financial reports for thorough analysis.
- Key Ratios: Metrics for profitability, leverage, and efficiency to assess performance.
- Dashboard and Charts: Visual representations of valuation results and underlying assumptions.
Disclaimer
All information, articles, and product details provided on this website are for general informational and educational purposes only. We do not claim any ownership over, nor do we intend to infringe upon, any trademarks, copyrights, logos, brand names, or other intellectual property mentioned or depicted on this site. Such intellectual property remains the property of its respective owners, and any references here are made solely for identification or informational purposes, without implying any affiliation, endorsement, or partnership.
We make no representations or warranties, express or implied, regarding the accuracy, completeness, or suitability of any content or products presented. Nothing on this website should be construed as legal, tax, investment, financial, medical, or other professional advice. In addition, no part of this site—including articles or product references—constitutes a solicitation, recommendation, endorsement, advertisement, or offer to buy or sell any securities, franchises, or other financial instruments, particularly in jurisdictions where such activity would be unlawful.
All content is of a general nature and may not address the specific circumstances of any individual or entity. It is not a substitute for professional advice or services. Any actions you take based on the information provided here are strictly at your own risk. You accept full responsibility for any decisions or outcomes arising from your use of this website and agree to release us from any liability in connection with your use of, or reliance upon, the content or products found herein.