
|
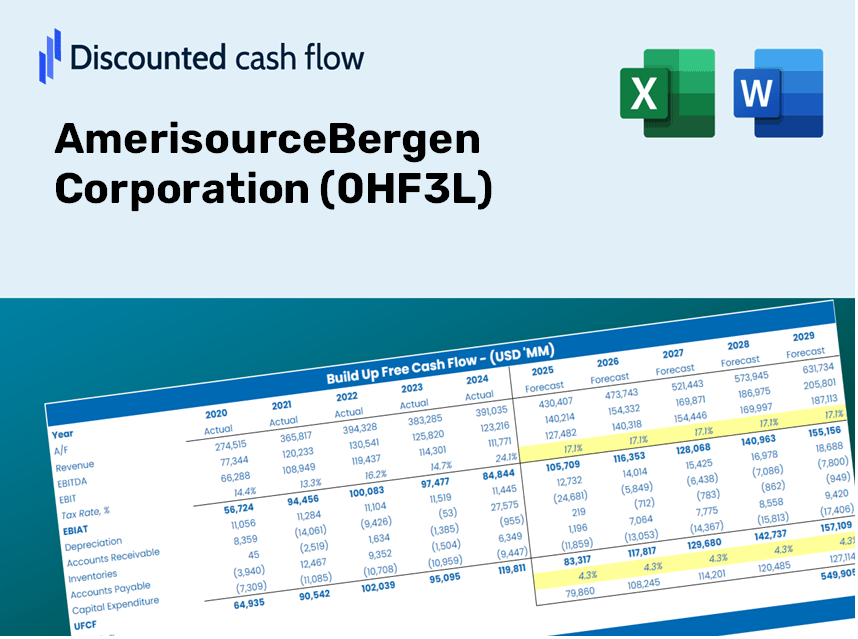
Amerisourcebergen Corporation (0HF3.L) DCF -Bewertung |
Fully Editable: Tailor To Your Needs In Excel Or Sheets
Professional Design: Trusted, Industry-Standard Templates
Investor-Approved Valuation Models
MAC/PC Compatible, Fully Unlocked
No Expertise Is Needed; Easy To Follow
Cencora (0HF3.L) Bundle
Unabhängig davon, ob Sie ein Investor oder Analyst sind, ist dieser (0HF3L) DCF-Taschenrechner Ihre Anlaufstelle für eine genaue Bewertung. Mit echten Daten der Amerisourcebergen Corporation geladen, können Sie Prognosen anpassen und die Auswirkungen in Echtzeit beobachten.
Discounted Cash Flow (DCF) - (USD MM)
| Year | AY1 2020 |
AY2 2021 |
AY3 2022 |
AY4 2023 |
AY5 2024 |
FY1 2025 |
FY2 2026 |
FY3 2027 |
FY4 2028 |
FY5 2029 |
|---|---|---|---|---|---|---|---|---|---|---|
| Revenue | 189,893.9 | 213,988.8 | 238,587.0 | 262,173.4 | 293,958.6 | 305,906.3 | 318,339.7 | 331,278.4 | 344,742.9 | 358,754.8 |
| Revenue Growth, % | 0 | 12.69 | 11.5 | 9.89 | 12.12 | 4.06 | 4.06 | 4.06 | 4.06 | 4.06 |
| EBITDA | -4,733.7 | 2,909.6 | 3,113.0 | 3,408.9 | 3,364.3 | 1,600.7 | 1,665.8 | 1,733.5 | 1,803.9 | 1,877.3 |
| EBITDA, % | -2.49 | 1.36 | 1.3 | 1.3 | 1.14 | 0.52327 | 0.52327 | 0.52327 | 0.52327 | 0.52327 |
| Depreciation | 401.6 | 505.2 | 697.9 | 972.4 | 1,111.7 | 911.1 | 948.1 | 986.7 | 1,026.8 | 1,068.5 |
| Depreciation, % | 0.2115 | 0.23607 | 0.29253 | 0.3709 | 0.37817 | 0.29783 | 0.29783 | 0.29783 | 0.29783 | 0.29783 |
| EBIT | -5,135.3 | 2,404.4 | 2,415.0 | 2,436.5 | 2,252.7 | 689.6 | 717.7 | 746.8 | 777.2 | 808.8 |
| EBIT, % | -2.7 | 1.12 | 1.01 | 0.92934 | 0.76632 | 0.22544 | 0.22544 | 0.22544 | 0.22544 | 0.22544 |
| Total Cash | 4,597.7 | 2,547.1 | 3,388.2 | 2,592.1 | 3,132.6 | 4,335.3 | 4,511.5 | 4,694.9 | 4,885.7 | 5,084.3 |
| Total Cash, percent | .0 | .0 | .0 | .0 | .0 | .0 | .0 | .0 | .0 | .0 |
| Account Receivables | 14,298.9 | 18,389.1 | 18,625.2 | 20,988.2 | 23,960.0 | 24,525.2 | 25,522.0 | 26,559.4 | 27,638.8 | 28,762.2 |
| Account Receivables, % | 7.53 | 8.59 | 7.81 | 8.01 | 8.15 | 8.02 | 8.02 | 8.02 | 8.02 | 8.02 |
| Inventories | 12,589.3 | 15,368.4 | 15,556.4 | 17,454.8 | 18,998.8 | 20,466.7 | 21,298.5 | 22,164.2 | 23,065.0 | 24,002.5 |
| Inventories, % | 6.63 | 7.18 | 6.52 | 6.66 | 6.46 | 6.69 | 6.69 | 6.69 | 6.69 | 6.69 |
| Accounts Payable | 31,705.1 | 38,010.0 | 40,192.9 | 45,836.0 | 50,942.2 | 52,688.0 | 54,829.4 | 57,057.9 | 59,377.0 | 61,790.3 |
| Accounts Payable, % | 16.7 | 17.76 | 16.85 | 17.48 | 17.33 | 17.22 | 17.22 | 17.22 | 17.22 | 17.22 |
| Capital Expenditure | -369.7 | -438.2 | -496.3 | -458.4 | -487.2 | -580.0 | -603.6 | -628.1 | -653.7 | -680.2 |
| Capital Expenditure, % | -0.19468 | -0.20478 | -0.20802 | -0.17483 | -0.16573 | -0.18961 | -0.18961 | -0.18961 | -0.18961 | -0.18961 |
| Tax Rate, % | 24.69 | 24.69 | 24.69 | 24.69 | 24.69 | 24.69 | 24.69 | 24.69 | 24.69 | 24.69 |
| EBITAT | -3,306.6 | 1,666.5 | 1,879.3 | 1,967.9 | 1,696.4 | 507.0 | 527.6 | 549.1 | 571.4 | 594.6 |
| Depreciation | ||||||||||
| Changes in Account Receivables | ||||||||||
| Changes in Inventories | ||||||||||
| Changes in Accounts Payable | ||||||||||
| Capital Expenditure | ||||||||||
| UFCF | 1,542.2 | 1,169.1 | 3,839.7 | 3,863.8 | 2,911.1 | 550.9 | 1,184.9 | 1,233.1 | 1,283.2 | 1,335.4 |
| WACC, % | 6.37 | 6.39 | 6.42 | 6.43 | 6.41 | 6.41 | 6.41 | 6.41 | 6.41 | 6.41 |
| PV UFCF | ||||||||||
| SUM PV UFCF | 4,567.5 | |||||||||
| Long Term Growth Rate, % | 3.90 | |||||||||
| Free cash flow (T + 1) | 1,387 | |||||||||
| Terminal Value | 55,329 | |||||||||
| Present Terminal Value | 40,559 | |||||||||
| Enterprise Value | 45,127 | |||||||||
| Net Debt | 1,255 | |||||||||
| Equity Value | 43,871 | |||||||||
| Diluted Shares Outstanding, MM | 200 | |||||||||
| Equity Value Per Share | 219.04 |
What You Will Receive
- Authentic ABC Financial Data: Offers both historical and projected figures for precise valuation.
- Customizable Inputs: Adjust WACC, tax rates, revenue growth, and capital expenditures as needed.
- Real-Time Calculations: Intrinsic value and NPV are computed automatically.
- Scenario Analysis: Explore various scenarios to assess the future performance of AmerisourceBergen Corporation (0HF3L).
- User-Friendly Design: Designed for professionals but easy to navigate for newcomers.
Key Features
- Real-Time ABC Data: Pre-filled with AmerisourceBergen's historical financial metrics and future projections.
- Completely Customizable Inputs: Modify parameters such as revenue growth, profit margins, WACC, tax rates, and capital expenditures.
- Dynamic Valuation Framework: Automatically recalculates Net Present Value (NPV) and intrinsic value in response to your inputs.
- Scenario Analysis: Develop multiple forecasting scenarios to examine various valuation outcomes.
- User-Centric Interface: Intuitive, organized, and suitable for both professionals and novices.
How It Works
- 1. Download the Template: Get the Excel file preloaded with data specific to AmerisourceBergen Corporation (0HF3L).
- 2. Adjust Assumptions: Modify important inputs such as growth rates, WACC, and capital expenditures.
- 3. View Results Instantly: The DCF model automatically calculates intrinsic value and NPV for your analysis.
- 4. Explore Scenarios: Evaluate different projections to understand various valuation results.
- 5. Present with Assurance: Deliver professional valuation insights that bolster your decision-making processes.
Why Opt for This Calculator?
- Designed for Experts: A sophisticated tool utilized by analysts, CFOs, and consultants.
- Accurate Data: AmerisourceBergen’s historical and projected financials loaded for precision.
- Scenario Analysis: Effortlessly test various forecasts and assumptions.
- Comprehensive Outputs: Instantly calculates intrinsic value, NPV, and essential metrics.
- User-Friendly: Detailed instructions lead you through each step of the process.
Who Should Utilize This Product?
- Investors: Evaluate AmerisourceBergen Corporation’s (0HF3L) valuation prior to making stock transactions.
- CFOs and Financial Analysts: Enhance valuation workflows and assess financial forecasts for (0HF3L).
- Startup Founders: Discover how leading public companies like AmerisourceBergen Corporation (0HF3L) are appraised.
- Consultants: Produce comprehensive valuation reports for your clientele pertaining to (0HF3L).
- Students and Educators: Apply real-world examples to practice and teach valuation methodologies using (0HF3L).
What the Template Contains
- Historical Data: Provides a comprehensive overview of AmerisourceBergen’s past financials and baseline forecasts.
- DCF and Levered DCF Models: In-depth templates to assess AmerisourceBergen’s intrinsic value.
- WACC Sheet: Pre-configured calculations for Weighted Average Cost of Capital.
- Editable Inputs: Customize key parameters such as growth rates, EBITDA %, and CAPEX assumptions.
- Quarterly and Annual Statements: Detailed insights into AmerisourceBergen’s financial performance.
- Interactive Dashboard: Visualize valuation outcomes and projections in an engaging manner.
Disclaimer
All information, articles, and product details provided on this website are for general informational and educational purposes only. We do not claim any ownership over, nor do we intend to infringe upon, any trademarks, copyrights, logos, brand names, or other intellectual property mentioned or depicted on this site. Such intellectual property remains the property of its respective owners, and any references here are made solely for identification or informational purposes, without implying any affiliation, endorsement, or partnership.
We make no representations or warranties, express or implied, regarding the accuracy, completeness, or suitability of any content or products presented. Nothing on this website should be construed as legal, tax, investment, financial, medical, or other professional advice. In addition, no part of this site—including articles or product references—constitutes a solicitation, recommendation, endorsement, advertisement, or offer to buy or sell any securities, franchises, or other financial instruments, particularly in jurisdictions where such activity would be unlawful.
All content is of a general nature and may not address the specific circumstances of any individual or entity. It is not a substitute for professional advice or services. Any actions you take based on the information provided here are strictly at your own risk. You accept full responsibility for any decisions or outcomes arising from your use of this website and agree to release us from any liability in connection with your use of, or reliance upon, the content or products found herein.