
|
Rithm Capital Corp. (0K76.L) DCF -Bewertung |
Fully Editable: Tailor To Your Needs In Excel Or Sheets
Professional Design: Trusted, Industry-Standard Templates
Investor-Approved Valuation Models
MAC/PC Compatible, Fully Unlocked
No Expertise Is Needed; Easy To Follow
Rithm Capital Corp. (0K76.L) Bundle
Unser (0K76L) DCF-Taschenrechner entwickelt für die Genauigkeit und ermöglicht es Ihnen, die Bewertung von Rithm Capital Corp. unter Verwendung realer Finanzdaten zu bewerten und vollständige Flexibilität zu bieten, um alle Schlüsselparameter für erweiterte Projektionen zu ändern.
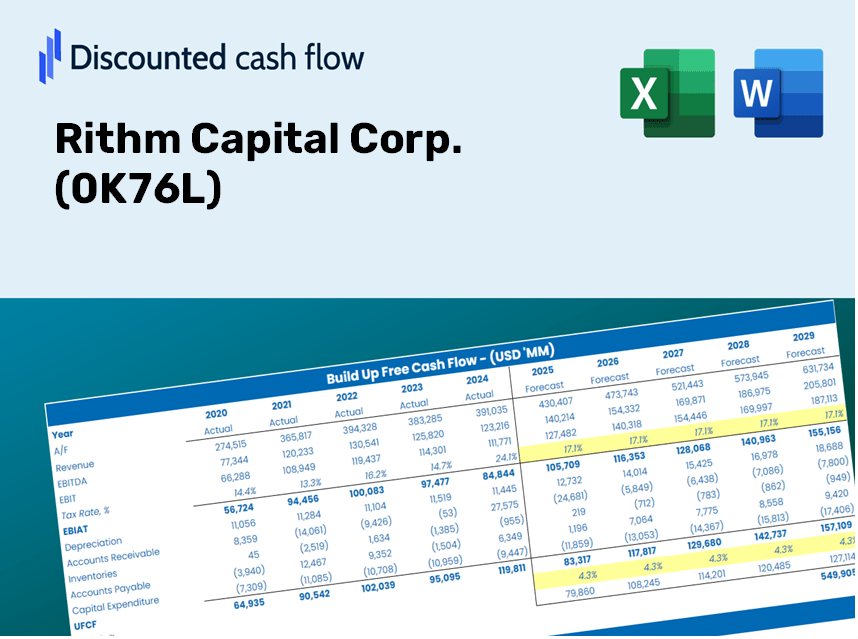
Discounted Cash Flow (DCF) - (USD MM)
| Year | AY1 2020 |
AY2 2021 |
AY3 2022 |
AY4 2023 |
AY5 2024 |
FY1 2025 |
FY2 2026 |
FY3 2027 |
FY4 2028 |
FY5 2029 |
|---|---|---|---|---|---|---|---|---|---|---|
| Revenue | 1,454.8 | 2,896.4 | 1,668.8 | 3,757.0 | 4,738.5 | 6,904.5 | 10,060.6 | 14,659.2 | 21,359.9 | 31,123.4 |
| Revenue Growth, % | 0 | 99.1 | -42.38 | 125.13 | 26.13 | 45.71 | 45.71 | 45.71 | 45.71 | 45.71 |
| EBITDA | -565.8 | 1,420.9 | 2,059.5 | 2,182.4 | 3,125.4 | 3,234.2 | 4,712.6 | 6,866.7 | 10,005.4 | 14,578.8 |
| EBITDA, % | -38.89 | 49.06 | 123.41 | 58.09 | 65.96 | 46.84 | 46.84 | 46.84 | 46.84 | 46.84 |
| Depreciation | .6 | 6.1 | 18.9 | 28.2 | 30.0 | 38.2 | 55.7 | 81.2 | 118.3 | 172.4 |
| Depreciation, % | 0.04296206 | 0.20964 | 1.13 | 0.7506 | 0.63311 | 0.55377 | 0.55377 | 0.55377 | 0.55377 | 0.55377 |
| EBIT | -566.5 | 1,414.9 | 2,040.6 | 2,154.2 | 3,095.4 | 3,211.6 | 4,679.6 | 6,818.7 | 9,935.5 | 14,477.0 |
| EBIT, % | -38.94 | 48.85 | 122.28 | 57.34 | 65.32 | 46.51 | 46.51 | 46.51 | 46.51 | 46.51 |
| Total Cash | 1,235.0 | 1,470.7 | 1,388.7 | 3,084.9 | 1,917.8 | 4,715.4 | 6,870.8 | 10,011.4 | 14,587.6 | 21,255.5 |
| Total Cash, percent | .0 | .0 | .0 | .0 | .0 | .0 | .0 | .0 | .0 | .0 |
| Account Receivables | 1,453.7 | 3,021.3 | 3,951.0 | 5,515.2 | 3,812.2 | 6,633.6 | 9,665.8 | 14,083.9 | 20,521.7 | 29,902.1 |
| Account Receivables, % | 99.93 | 104.31 | 236.76 | 146.8 | 80.45 | 96.08 | 96.08 | 96.08 | 96.08 | 96.08 |
| Inventories | .0 | .0 | -52.2 | .0 | .0 | -43.2 | -63.0 | -91.8 | -133.7 | -194.8 |
| Inventories, % | 0 | 0 | -3.13 | 0 | 0 | -0.62594 | -0.62594 | -0.62594 | -0.62594 | -0.62594 |
| Accounts Payable | 87.6 | 345.9 | 886.7 | 165.1 | 133.0 | 1,081.2 | 1,575.5 | 2,295.6 | 3,344.9 | 4,873.8 |
| Accounts Payable, % | 6.02 | 11.94 | 53.13 | 4.4 | 2.81 | 15.66 | 15.66 | 15.66 | 15.66 | 15.66 |
| Capital Expenditure | .0 | 65.4 | .0 | 459.8 | .0 | .0 | .0 | .0 | .0 | .0 |
| Capital Expenditure, % | 0 | 2.26 | 0 | 12.24 | 0 | 0 | 0 | 0 | 0 | 0 |
| Tax Rate, % | 22.94 | 22.94 | 22.94 | 22.94 | 22.94 | 22.94 | 22.94 | 22.94 | 22.94 | 22.94 |
| EBITAT | -595.9 | 1,133.6 | 1,542.4 | 1,780.5 | 2,385.3 | 2,668.4 | 3,888.1 | 5,665.3 | 8,254.9 | 12,028.2 |
| Depreciation | ||||||||||
| Changes in Account Receivables | ||||||||||
| Changes in Inventories | ||||||||||
| Changes in Accounts Payable | ||||||||||
| Capital Expenditure | ||||||||||
| UFCF | -1,961.4 | -104.1 | 1,224.7 | -69.5 | 4,086.3 | 876.6 | 1,425.6 | 2,077.2 | 3,026.7 | 4,410.2 |
| WACC, % | 4.41 | 3.79 | 3.65 | 3.87 | 3.7 | 3.89 | 3.89 | 3.89 | 3.89 | 3.89 |
| PV UFCF | ||||||||||
| SUM PV UFCF | 10,261.0 | |||||||||
| Long Term Growth Rate, % | 2.00 | |||||||||
| Free cash flow (T + 1) | 4,498 | |||||||||
| Terminal Value | 238,536 | |||||||||
| Present Terminal Value | 197,139 | |||||||||
| Enterprise Value | 207,400 | |||||||||
| Net Debt | 33,621 | |||||||||
| Equity Value | 173,778 | |||||||||
| Diluted Shares Outstanding, MM | 500 | |||||||||
| Equity Value Per Share | 347.84 |
What You Will Receive
- Genuine Rithm Capital Data: Comprehensive financial information – encompassing revenue to EBIT – derived from real and forecasted figures.
- Complete Customization: Modify all essential parameters (highlighted in yellow) such as WACC, growth %, and tax rates.
- Immediate Valuation Adjustments: Automatic recalculations to assess the impact of changes on Rithm Capital's fair value.
- Flexible Excel Template: Designed for effortless edits, scenario analysis, and in-depth projections.
- Efficient and Precise: Eliminate the need to build models from the ground up while ensuring accuracy and adaptability.
Key Features
- 🔍 Real-Life Rithm Capital Financials: Pre-filled historical and projected data for Rithm Capital Corp. (0K76L).
- ✏️ Fully Customizable Inputs: Modify all essential parameters (yellow cells) such as WACC, growth %, and tax rates.
- 📊 Professional DCF Valuation: Integrated formulas calculate Rithm Capital’s intrinsic value using the Discounted Cash Flow method.
- ⚡ Instant Results: Immediately visualize Rithm Capital’s valuation after adjustments.
- Scenario Analysis: Examine and compare outcomes for different financial assumptions side-by-side.
How It Works
- 1. Access the Template: Download and open the Excel file containing Rithm Capital Corp.'s data (0K76L).
- 2. Adjust Assumptions: Modify essential inputs such as growth rates, WACC, and capital expenditures to fit your analysis.
- 3. Get Instant Results: The DCF model automatically computes the intrinsic value and NPV based on your inputs.
- 4. Explore Scenarios: Evaluate various forecasts to understand different valuation possibilities.
- 5. Present with Assurance: Deliver professional valuation insights to guide your financial decisions.
Why Choose This Calculator for Rithm Capital Corp. (0K76L)?
- Designed for Experts: A sophisticated tool tailored for analysts, CFOs, and consultants.
- Accurate Financials: Historical and projected data for Rithm Capital Corp. integrated for precision.
- Flexible Scenario Analysis: Effortlessly test various forecasts and assumptions.
- Clear Results: Automatically generates intrinsic value, NPV, and essential metrics.
- User-Friendly: Comprehensive, step-by-step guidance throughout the calculation process.
Who Can Benefit from Rithm Capital Corp. (0K76L)?
- Investors: Empower your investment choices with our advanced valuation tools.
- Financial Analysts: Streamline your workflow with our ready-to-customize DCF model.
- Consultants: Effortlessly modify the template for impactful client presentations or reports.
- Finance Enthusiasts: Enhance your knowledge of valuation methods through practical, real-world examples.
- Educators and Students: Utilize our resources as a hands-on learning aid in finance curricula.
Contents of the Template
- Pre-Filled Data: Contains Rithm Capital Corp.'s historical financials and projections.
- Discounted Cash Flow Model: An editable DCF valuation model with automatic calculation features.
- Weighted Average Cost of Capital (WACC): A specific sheet for determining WACC based on user-defined inputs.
- Key Financial Ratios: Evaluate Rithm Capital Corp.'s profitability, efficiency, and leverage metrics.
- Customizable Inputs: Easily modify revenue growth, profit margins, and tax rates.
- Clear Dashboard: Visualizations and tables that summarize essential valuation results.
Disclaimer
All information, articles, and product details provided on this website are for general informational and educational purposes only. We do not claim any ownership over, nor do we intend to infringe upon, any trademarks, copyrights, logos, brand names, or other intellectual property mentioned or depicted on this site. Such intellectual property remains the property of its respective owners, and any references here are made solely for identification or informational purposes, without implying any affiliation, endorsement, or partnership.
We make no representations or warranties, express or implied, regarding the accuracy, completeness, or suitability of any content or products presented. Nothing on this website should be construed as legal, tax, investment, financial, medical, or other professional advice. In addition, no part of this site—including articles or product references—constitutes a solicitation, recommendation, endorsement, advertisement, or offer to buy or sell any securities, franchises, or other financial instruments, particularly in jurisdictions where such activity would be unlawful.
All content is of a general nature and may not address the specific circumstances of any individual or entity. It is not a substitute for professional advice or services. Any actions you take based on the information provided here are strictly at your own risk. You accept full responsibility for any decisions or outcomes arising from your use of this website and agree to release us from any liability in connection with your use of, or reliance upon, the content or products found herein.