
|
Verbio Vereinigte Bioenergie AG (0Nly.L) DCF -Bewertung |
Fully Editable: Tailor To Your Needs In Excel Or Sheets
Professional Design: Trusted, Industry-Standard Templates
Investor-Approved Valuation Models
MAC/PC Compatible, Fully Unlocked
No Expertise Is Needed; Easy To Follow
VERBIO Vereinigte BioEnergie AG (0NLY.L) Bundle
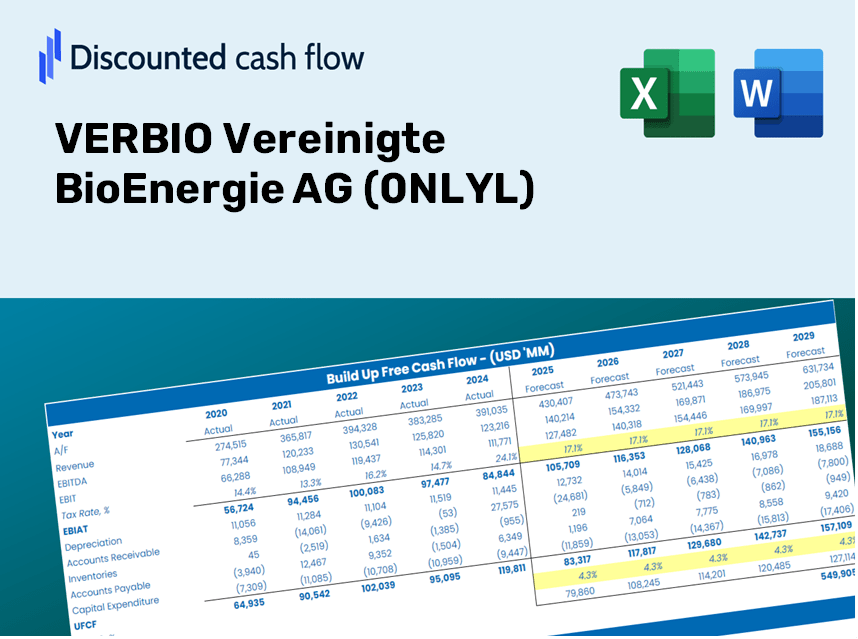
Gewinnen Sie Einblick in Ihre verbio vereinigte bioenergie ag (0nlyl) Bewertungsanalyse mit unserem ausgefeilten DCF -Taschenrechner! Diese Excel -Vorlage wird mit realen 0nlyl -Daten vorinstalliert, sodass Sie Prognosen und Annahmen verfeinern können, um den inneren Wert von verbio vereinigte bioenergie ag genau zu bestimmen.
Benefits of Choosing VERBIO
- Authentic VERBIO Financial Data: Access historical and projected figures for precise valuation.
- Customizable Parameters: Adjust WACC, tax rates, revenue growth, and capital expenditures to suit your analysis.
- Automated Calculations: Dynamic calculations for intrinsic value and NPV ensure timely insights.
- Scenario Analysis: Explore various scenarios to assess VERBIO's future performance potential.
- User-Friendly Interface: Designed for professionals but easy to navigate for newcomers.
Key Features
- Genuine VERBIO Data: Get reliable historical and future financial information pre-loaded for your analysis.
- Adjustable Forecast Parameters: Modify highlighted cells, including WACC, growth rates, and profit margins.
- Interactive Calculations: Automatic recalculations for DCF, Net Present Value (NPV), and cash flow evaluations.
- Intuitive Dashboard: User-friendly graphs and summaries to help you visualize your valuation outcomes.
- Suitable for All Levels: A straightforward, intuitive design tailored for investors, CFOs, and consultants alike.
How It Functions
- Step 1: Download the Excel spreadsheet.
- Step 2: Examine VERBIO's pre-populated financial data and projections.
- Step 3: Adjust key variables such as revenue growth, WACC, and tax rates (cells marked for easy identification).
- Step 4: Observe the DCF model refresh in real-time as you modify your assumptions.
- Step 5: Evaluate the results and leverage them for your investment strategies.
Reasons to Choose the VERBIO Calculator
- Time Efficiency: Skip the hassle of building a DCF model from the ground up – it's ready for immediate use.
- Enhanced Accuracy: Dependable financial data and calculations help minimize valuation errors.
- Fully Adaptable: Customize the model to align with your assumptions and forecasts.
- User-Friendly: Intuitive charts and outputs ensure results are easy to understand.
- Endorsed by Professionals: Created for experts who prioritize precision and functionality.
Who Can Benefit from VERBIO's Solutions?
- Investors: Make informed decisions with our advanced bioenergy evaluation tools.
- Financial Analysts: Enhance efficiency with a ready-to-use financial model tailored for bioenergy assessments.
- Consultants: Easily modify our templates for impactful presentations or comprehensive reports for clients.
- Energy Enthusiasts: Expand your knowledge of bioenergy valuation methods through practical, real-world case studies.
- Educators and Students: Utilize our resources as a hands-on learning aid in energy finance courses.
Contents of the Template
- Pre-Populated Data: Features historical financial information and projections for VERBIO Vereinigte BioEnergie AG (0NLYL).
- Discounted Cash Flow Model: An editable DCF valuation framework with automated calculations.
- Weighted Average Cost of Capital (WACC): A specific sheet designed for computing WACC using tailored inputs.
- Essential Financial Ratios: Evaluate VERBIO's profitability, operational efficiency, and capital structure.
- Customizable Parameters: Easily modify revenue growth rates, profit margins, and tax assumptions.
- User-Friendly Dashboard: Visual representations and tables that summarize key valuation findings.
Disclaimer
All information, articles, and product details provided on this website are for general informational and educational purposes only. We do not claim any ownership over, nor do we intend to infringe upon, any trademarks, copyrights, logos, brand names, or other intellectual property mentioned or depicted on this site. Such intellectual property remains the property of its respective owners, and any references here are made solely for identification or informational purposes, without implying any affiliation, endorsement, or partnership.
We make no representations or warranties, express or implied, regarding the accuracy, completeness, or suitability of any content or products presented. Nothing on this website should be construed as legal, tax, investment, financial, medical, or other professional advice. In addition, no part of this site—including articles or product references—constitutes a solicitation, recommendation, endorsement, advertisement, or offer to buy or sell any securities, franchises, or other financial instruments, particularly in jurisdictions where such activity would be unlawful.
All content is of a general nature and may not address the specific circumstances of any individual or entity. It is not a substitute for professional advice or services. Any actions you take based on the information provided here are strictly at your own risk. You accept full responsibility for any decisions or outcomes arising from your use of this website and agree to release us from any liability in connection with your use of, or reliance upon, the content or products found herein.