
|
NH Hotel Group, S.A. (0OHG.L) DCF -Bewertung |
Fully Editable: Tailor To Your Needs In Excel Or Sheets
Professional Design: Trusted, Industry-Standard Templates
Investor-Approved Valuation Models
MAC/PC Compatible, Fully Unlocked
No Expertise Is Needed; Easy To Follow
NH Hotel Group, S.A. (0OHG.L) Bundle
Möchten Sie den inneren Wert der NH Hotel Group, S. A., bestimmen? Unser (0OHGL) DCF-Taschenrechner integriert reale Daten mit umfangreichen Anpassungsfunktionen, sodass Sie Projektionen anpassen und Ihre Investitionsauswahl verbessern können.
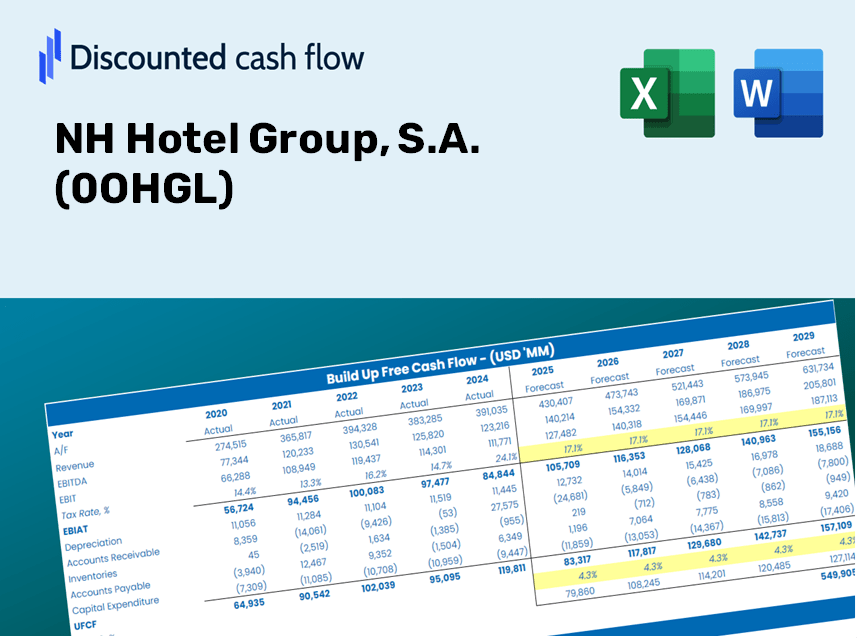
Discounted Cash Flow (DCF) - (USD MM)
| Year | AY1 2020 |
AY2 2021 |
AY3 2022 |
AY4 2023 |
AY5 2024 |
FY1 2025 |
FY2 2026 |
FY3 2027 |
FY4 2028 |
FY5 2029 |
|---|---|---|---|---|---|---|---|---|---|---|
| Revenue | 536.2 | 746.5 | 1,722.4 | 2,159.0 | 2,417.9 | 2,252.4 | 2,098.3 | 1,954.7 | 1,820.9 | 1,696.3 |
| Revenue Growth, % | 0 | 39.23 | 130.73 | 25.35 | 11.99 | -6.84 | -6.84 | -6.84 | -6.84 | -6.84 |
| EBITDA | -70.0 | 257.5 | 549.8 | 638.9 | 688.0 | 501.9 | 467.5 | 435.6 | 405.7 | 378.0 |
| EBITDA, % | -13.06 | 34.5 | 31.92 | 29.59 | 28.45 | 22.28 | 22.28 | 22.28 | 22.28 | 22.28 |
| Depreciation | 302.5 | 280.2 | 277.3 | 292.4 | 303.4 | 613.3 | 571.4 | 532.3 | 495.8 | 461.9 |
| Depreciation, % | 56.42 | 37.54 | 16.1 | 13.54 | 12.55 | 27.23 | 27.23 | 27.23 | 27.23 | 27.23 |
| EBIT | -372.5 | -22.7 | 272.5 | 346.5 | 384.5 | -111.4 | -103.8 | -96.7 | -90.1 | -83.9 |
| EBIT, % | -69.47 | -3.04 | 15.82 | 16.05 | 15.9 | -4.95 | -4.95 | -4.95 | -4.95 | -4.95 |
| Total Cash | 320.9 | 243.9 | 301.8 | 216.0 | 225.0 | 582.7 | 542.8 | 505.7 | 471.1 | 438.8 |
| Total Cash, percent | .0 | .0 | .0 | .0 | .0 | .0 | .0 | .0 | .0 | .0 |
| Account Receivables | 30.9 | 50.1 | 108.6 | 210.2 | 189.5 | 163.8 | 152.6 | 142.1 | 132.4 | 123.4 |
| Account Receivables, % | 5.76 | 6.72 | 6.3 | 9.74 | 7.84 | 7.27 | 7.27 | 7.27 | 7.27 | 7.27 |
| Inventories | 8.0 | 9.6 | 12.6 | 15.3 | 17.3 | 22.2 | 20.7 | 19.2 | 17.9 | 16.7 |
| Inventories, % | 1.48 | 1.28 | 0.73092 | 0.70862 | 0.71633 | 0.98456 | 0.98456 | 0.98456 | 0.98456 | 0.98456 |
| Accounts Payable | 164.6 | 230.6 | 263.6 | 301.4 | 296.0 | 464.5 | 432.7 | 403.1 | 375.5 | 349.8 |
| Accounts Payable, % | 30.69 | 30.9 | 15.31 | 13.96 | 12.24 | 20.62 | 20.62 | 20.62 | 20.62 | 20.62 |
| Capital Expenditure | -105.5 | -36.8 | -49.4 | -118.1 | -162.3 | -178.6 | -166.4 | -155.0 | -144.4 | -134.5 |
| Capital Expenditure, % | -19.67 | -4.93 | -2.87 | -5.47 | -6.71 | -7.93 | -7.93 | -7.93 | -7.93 | -7.93 |
| Tax Rate, % | 20.67 | 20.67 | 20.67 | 20.67 | 20.67 | 20.67 | 20.67 | 20.67 | 20.67 | 20.67 |
| EBITAT | -315.9 | -20.9 | 175.6 | 218.5 | 305.1 | -85.5 | -79.7 | -74.2 | -69.1 | -64.4 |
| Depreciation | ||||||||||
| Changes in Account Receivables | ||||||||||
| Changes in Inventories | ||||||||||
| Changes in Accounts Payable | ||||||||||
| Capital Expenditure | ||||||||||
| UFCF | 6.9 | 267.7 | 375.1 | 326.3 | 459.4 | 538.5 | 306.2 | 285.3 | 265.7 | 247.6 |
| WACC, % | 8.2 | 8.4 | 7.62 | 7.58 | 8.04 | 7.97 | 7.97 | 7.97 | 7.97 | 7.97 |
| PV UFCF | ||||||||||
| SUM PV UFCF | 1,352.5 | |||||||||
| Long Term Growth Rate, % | 2.00 | |||||||||
| Free cash flow (T + 1) | 253 | |||||||||
| Terminal Value | 4,232 | |||||||||
| Present Terminal Value | 2,885 | |||||||||
| Enterprise Value | 4,237 | |||||||||
| Net Debt | 2,250 | |||||||||
| Equity Value | 1,987 | |||||||||
| Diluted Shares Outstanding, MM | 436 | |||||||||
| Equity Value Per Share | 4.56 |
What You Will Receive
- Customizable Excel Template: An adaptable Excel-based DCF Calculator featuring pre-filled financial data for NH Hotel Group, S.A. (0OHGL).
- Accurate Market Data: Access to historical performance metrics and forward-looking projections (highlighted in the yellow cells).
- Flexible Forecasting: Modify key assumptions such as revenue growth rates, EBITDA margins, and discount rates (WACC).
- Instant Calculations: Observe immediate effects of your inputs on the valuation of NH Hotel Group, S.A. (0OHGL).
- Professional Resource: Designed specifically for investors, CFOs, consultants, and financial analysts.
- Intuitive Layout: Organized for ease of understanding and usability, complete with step-by-step guidance.
Key Features
- 🔍 Real-Life NH Hotel Group Financials: Pre-filled historical and projected data for NH Hotel Group, S.A. (0OHGL).
- ✏️ Fully Customizable Inputs: Modify all essential parameters (yellow cells) such as WACC, growth %, and tax rates.
- 📊 Professional DCF Valuation: Integrated formulas determine the intrinsic value of NH Hotel Group using the Discounted Cash Flow method.
- ⚡ Instant Results: Visualize NH Hotel Group’s valuation in real-time after making adjustments.
- Scenario Analysis: Explore and compare various financial assumptions and their outcomes side-by-side.
How It Functions
- 1. Download the Template: Get the Excel file containing NH Hotel Group, S.A.’s (0OHGL) preloaded data.
- 2. Adjust Key Assumptions: Modify essential inputs such as growth rates, WACC, and capital expenditures.
- 3. Instantaneous Results: The DCF model automatically calculates intrinsic value and NPV in real-time.
- 4. Evaluate Different Scenarios: Analyze various forecasts to explore a range of valuation outcomes.
- 5. Make Informed Decisions: Deliver professional valuation insights to enhance your decision-making process.
Why Choose This Calculator?
- Designed for Industry Experts: A sophisticated tool tailored for analysts, CFOs, and consultants.
- Comprehensive Data: NH Hotel Group’s historical and projected financials are preloaded for precision.
- Forecast Simulation: Effortlessly model various scenarios and assumptions.
- Transparent Results: Instantly computes intrinsic value, NPV, and other key metrics.
- User-Friendly: Detailed step-by-step guidance helps you navigate the process.
Who Can Benefit from NH Hotel Group, S.A. (0OHGL)?
- Investors: Gain insights with a premium valuation tool tailored for hotel investments.
- Financial Analysts: Streamline your analysis with our ready-to-use DCF model, designed for easy customization.
- Consultants: Effortlessly modify the template for impactful client presentations or comprehensive reports.
- Hospitality Enthusiasts: Enhance your knowledge of valuation techniques through real-world hotel industry examples.
- Educators and Students: Leverage this as a hands-on resource in hospitality and finance courses.
Contents of the Template
- Pre-Filled DCF Model: NH Hotel Group's financial data preloaded for immediate use.
- WACC Calculator: Comprehensive calculations for Weighted Average Cost of Capital.
- Financial Ratios: Assess NH Hotel Group's profitability, leverage, and efficiency.
- Editable Inputs: Modify assumptions such as growth, margins, and CAPEX to suit your scenarios.
- Financial Statements: Annual and quarterly reports to facilitate thorough analysis.
- Interactive Dashboard: Effortlessly visualize key valuation metrics and outcomes.
Disclaimer
All information, articles, and product details provided on this website are for general informational and educational purposes only. We do not claim any ownership over, nor do we intend to infringe upon, any trademarks, copyrights, logos, brand names, or other intellectual property mentioned or depicted on this site. Such intellectual property remains the property of its respective owners, and any references here are made solely for identification or informational purposes, without implying any affiliation, endorsement, or partnership.
We make no representations or warranties, express or implied, regarding the accuracy, completeness, or suitability of any content or products presented. Nothing on this website should be construed as legal, tax, investment, financial, medical, or other professional advice. In addition, no part of this site—including articles or product references—constitutes a solicitation, recommendation, endorsement, advertisement, or offer to buy or sell any securities, franchises, or other financial instruments, particularly in jurisdictions where such activity would be unlawful.
All content is of a general nature and may not address the specific circumstances of any individual or entity. It is not a substitute for professional advice or services. Any actions you take based on the information provided here are strictly at your own risk. You accept full responsibility for any decisions or outcomes arising from your use of this website and agree to release us from any liability in connection with your use of, or reliance upon, the content or products found herein.