
|
Arbonia AG (0QKR.L) DCF -Bewertung |
Fully Editable: Tailor To Your Needs In Excel Or Sheets
Professional Design: Trusted, Industry-Standard Templates
Investor-Approved Valuation Models
MAC/PC Compatible, Fully Unlocked
No Expertise Is Needed; Easy To Follow
Arbonia AG (0QKR.L) Bundle
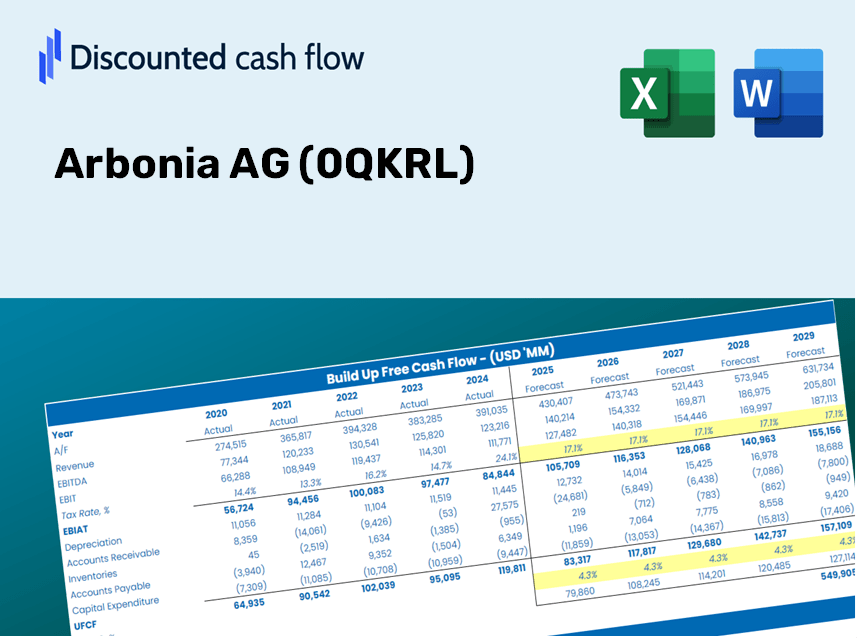
Als Anleger oder Analyst dient der DCF-Taschenrechner der Arbonia AG (0QKRL) als Anlaufstelle für eine genaue Bewertung. Ausgestattet mit realen Daten von Arbonia AG können Sie problemlos Prognosen anpassen und die Effekte in Echtzeit beobachten.
What You Will Receive
- Authentic Arbonia AG Financial Data: Pre-populated with historical and projected figures for accurate analysis.
- Completely Customizable Template: Easily adjust essential inputs such as revenue growth, WACC, and EBITDA %.
- Instant Calculations: Watch Arbonia AG's intrinsic value refresh in real-time as you make adjustments.
- Professional Valuation Tool: Crafted for investors, analysts, and consultants aiming for precise DCF outcomes.
- User-Friendly Interface: Streamlined layout and straightforward instructions suitable for all skill levels.
Key Features
- Comprehensive DCF Calculator: Features thorough unlevered and levered DCF valuation models tailored for Arbonia AG (0QKRL).
- WACC Calculator: Offers a pre-designed Weighted Average Cost of Capital sheet with adjustable parameters.
- Customizable Forecast Assumptions: Easily alter growth projections, capital expenditures, and discount rates.
- Integrated Financial Ratios: Evaluate profitability, leverage, and efficiency ratios specific to Arbonia AG (0QKRL).
- Visual Dashboard and Charts: Graphical representations summarize essential valuation metrics for straightforward analysis.
How It Works
- Step 1: Download the Excel file.
- Step 2: Examine the pre-populated Arbonia AG (0QKRL) data (historical and projected).
- Step 3: Modify key assumptions (yellow cells) according to your analysis.
- Step 4: Observe automatic recalculations for Arbonia AG's intrinsic value.
- Step 5: Utilize the outputs for making investment decisions or for reporting purposes.
Why Select This Calculator for Arbonia AG (0QKRL)?
- User-Friendly Interface: Tailored for both novices and experienced users.
- Customizable Inputs: Adjust parameters effortlessly to suit your analysis needs.
- Real-Time Insights: Observe immediate fluctuations in Arbonia’s valuation as you modify the inputs.
- Preconfigured Data: Comes with Arbonia’s actual financial details for swift evaluations.
- Endorsed by Experts: Utilized by investors and analysts for well-informed decision-making.
Who Can Benefit from This Product?
- Investors: Assess Arbonia AG’s (0QKRL) valuation prior to executing buy or sell decisions.
- CFOs and Financial Analysts: Optimize valuation methodologies and evaluate financial forecasts.
- Startup Founders: Discover the valuation strategies used by leading public companies like Arbonia AG.
- Consultants: Provide comprehensive valuation reports for your clients’ needs.
- Students and Educators: Utilize real data to learn and teach effective valuation practices.
Contents of the Template
- Historical Data: Includes Arbonia AG’s past financial performance and baseline forecasts.
- DCF and Levered DCF Models: Comprehensive templates for calculating the intrinsic value of Arbonia AG.
- WACC Sheet: Pre-constructed calculations for Weighted Average Cost of Capital.
- Editable Inputs: Adjust key factors such as growth rates, EBITDA %, and CAPEX assumptions.
- Quarterly and Annual Statements: A thorough breakdown of Arbonia AG’s financial data.
- Interactive Dashboard: Dynamically visualize valuation results and forecasts.
Disclaimer
All information, articles, and product details provided on this website are for general informational and educational purposes only. We do not claim any ownership over, nor do we intend to infringe upon, any trademarks, copyrights, logos, brand names, or other intellectual property mentioned or depicted on this site. Such intellectual property remains the property of its respective owners, and any references here are made solely for identification or informational purposes, without implying any affiliation, endorsement, or partnership.
We make no representations or warranties, express or implied, regarding the accuracy, completeness, or suitability of any content or products presented. Nothing on this website should be construed as legal, tax, investment, financial, medical, or other professional advice. In addition, no part of this site—including articles or product references—constitutes a solicitation, recommendation, endorsement, advertisement, or offer to buy or sell any securities, franchises, or other financial instruments, particularly in jurisdictions where such activity would be unlawful.
All content is of a general nature and may not address the specific circumstances of any individual or entity. It is not a substitute for professional advice or services. Any actions you take based on the information provided here are strictly at your own risk. You accept full responsibility for any decisions or outcomes arising from your use of this website and agree to release us from any liability in connection with your use of, or reliance upon, the content or products found herein.