
|
Die DCF -Bewertung der Swatch Group AG (0QM4.L) |
Fully Editable: Tailor To Your Needs In Excel Or Sheets
Professional Design: Trusted, Industry-Standard Templates
Investor-Approved Valuation Models
MAC/PC Compatible, Fully Unlocked
No Expertise Is Needed; Easy To Follow
The Swatch Group AG (0QM4.L) Bundle
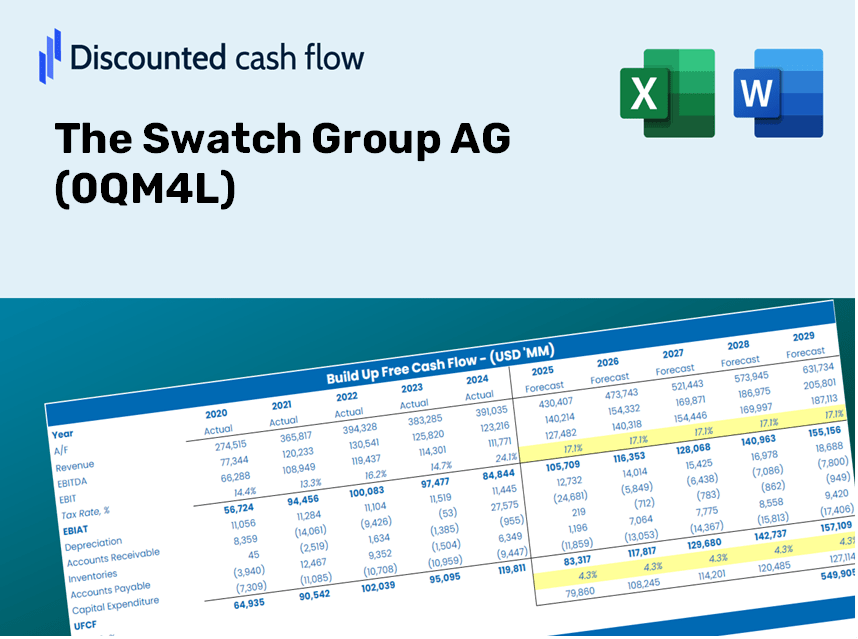
Entdecken Sie den finanziellen Ausblick von Swatch Group AG (0QM4L) mit unserem benutzerfreundlichen DCF-Taschenrechner! Geben Sie Ihre Projektionen für Wachstum, Margen und Kosten ein, um den intrinsischen Wert der Swatch Group AG (0QM4L) zu berechnen und Ihren Investitionsansatz zu formen.
Discounted Cash Flow (DCF) - (USD MM)
| Year | AY1 2020 |
AY2 2021 |
AY3 2022 |
AY4 2023 |
AY5 2024 |
FY1 2025 |
FY2 2026 |
FY3 2027 |
FY4 2028 |
FY5 2029 |
|---|---|---|---|---|---|---|---|---|---|---|
| Revenue | 5,595.0 | 7,313.0 | 7,499.0 | 7,888.0 | 6,735.0 | 7,136.1 | 7,561.0 | 8,011.3 | 8,488.3 | 8,993.8 |
| Revenue Growth, % | 0 | 30.71 | 2.54 | 5.19 | -14.62 | 5.95 | 5.95 | 5.95 | 5.95 | 5.95 |
| EBITDA | 455.0 | 1,427.0 | 1,437.0 | 1,546.0 | 764.0 | 1,109.7 | 1,175.8 | 1,245.8 | 1,320.0 | 1,398.6 |
| EBITDA, % | 8.13 | 19.51 | 19.16 | 19.6 | 11.34 | 15.55 | 15.55 | 15.55 | 15.55 | 15.55 |
| Depreciation | 463.0 | 438.0 | 407.0 | 390.0 | 416.0 | 439.8 | 466.0 | 493.7 | 523.1 | 554.2 |
| Depreciation, % | 8.28 | 5.99 | 5.43 | 4.94 | 6.18 | 6.16 | 6.16 | 6.16 | 6.16 | 6.16 |
| EBIT | -8.0 | 989.0 | 1,030.0 | 1,156.0 | 348.0 | 669.9 | 709.8 | 752.1 | 796.9 | 844.3 |
| EBIT, % | -0.14298 | 13.52 | 13.74 | 14.66 | 5.17 | 9.39 | 9.39 | 9.39 | 9.39 | 9.39 |
| Total Cash | 1,792.0 | 2,656.0 | 2,548.0 | 2,047.0 | 1,396.0 | 2,126.6 | 2,253.2 | 2,387.4 | 2,529.6 | 2,680.2 |
| Total Cash, percent | .0 | .0 | .0 | .0 | .0 | .0 | .0 | .0 | .0 | .0 |
| Account Receivables | 897.0 | 846.0 | 766.0 | 672.0 | 692.0 | 807.9 | 856.0 | 907.0 | 961.0 | 1,018.3 |
| Account Receivables, % | 16.03 | 11.57 | 10.21 | 8.52 | 10.27 | 11.32 | 11.32 | 11.32 | 11.32 | 11.32 |
| Inventories | 6,315.0 | 6,389.0 | 6,873.0 | 7,309.0 | 7,641.0 | 6,731.8 | 7,132.7 | 7,557.5 | 8,007.5 | 8,484.3 |
| Inventories, % | 112.87 | 87.36 | 91.65 | 92.66 | 113.45 | 94.34 | 94.34 | 94.34 | 94.34 | 94.34 |
| Accounts Payable | 281.0 | 313.0 | 298.0 | 317.0 | 270.0 | 304.1 | 322.2 | 341.3 | 361.7 | 383.2 |
| Accounts Payable, % | 5.02 | 4.28 | 3.97 | 4.02 | 4.01 | 4.26 | 4.26 | 4.26 | 4.26 | 4.26 |
| Capital Expenditure | -253.0 | -303.0 | -399.0 | -785.0 | -549.0 | -458.0 | -485.3 | -514.1 | -544.8 | -577.2 |
| Capital Expenditure, % | -4.52 | -4.14 | -5.32 | -9.95 | -8.15 | -6.42 | -6.42 | -6.42 | -6.42 | -6.42 |
| Tax Rate, % | 44.06 | 44.06 | 44.06 | 44.06 | 44.06 | 44.06 | 44.06 | 44.06 | 44.06 | 44.06 |
| EBITAT | 8.9 | 741.8 | 744.1 | 872.0 | 194.7 | 373.3 | 395.5 | 419.1 | 444.0 | 470.5 |
| Depreciation | ||||||||||
| Changes in Account Receivables | ||||||||||
| Changes in Inventories | ||||||||||
| Changes in Accounts Payable | ||||||||||
| Capital Expenditure | ||||||||||
| UFCF | -6,712.1 | 885.8 | 333.1 | 154.0 | -337.3 | 1,182.4 | -54.6 | -57.9 | -61.3 | -65.0 |
| WACC, % | 7.62 | 7.68 | 7.67 | 7.68 | 7.66 | 7.66 | 7.66 | 7.66 | 7.66 | 7.66 |
| PV UFCF | ||||||||||
| SUM PV UFCF | 914.1 | |||||||||
| Long Term Growth Rate, % | 2.00 | |||||||||
| Free cash flow (T + 1) | -66 | |||||||||
| Terminal Value | -1,171 | |||||||||
| Present Terminal Value | -810 | |||||||||
| Enterprise Value | 104 | |||||||||
| Net Debt | -1,090 | |||||||||
| Equity Value | 1,194 | |||||||||
| Diluted Shares Outstanding, MM | 52 | |||||||||
| Equity Value Per Share | 23.11 |
What You Will Receive
- Authentic Swatch Data: Preloaded financials – covering everything from revenue to EBIT – based on real and projected metrics.
- Complete Customization: Modify all essential parameters (yellow cells) such as WACC, growth %, and tax rates.
- Immediate Valuation Updates: Automatic recalculations to assess the effects of changes on Swatch Group's fair value.
- Flexible Excel Template: Designed for quick adjustments, scenario analysis, and comprehensive forecasts.
- Efficient and Precise: Avoid building models from the ground up while ensuring accuracy and adaptability.
Key Features
- Real-Time Swatch Group Data: Pre-filled with the Swatch Group AG’s historical financial performance and future projections.
- Completely Customizable Inputs: Modify revenue growth, profit margins, discount rates, tax percentages, and capital expenditures.
- Adaptive Valuation Model: Automatic recalculations of Net Present Value (NPV) and intrinsic value based on your input changes.
- Scenario Analysis: Develop multiple forecast scenarios to evaluate various valuation possibilities.
- User-Friendly Interface: Intuitive, well-structured design suitable for both seasoned professionals and newcomers.
How It Operates
- 1. Access the Template: Download and open the Excel file featuring The Swatch Group AG's preloaded data.
- 2. Adjust Assumptions: Modify essential inputs, including growth rates, WACC, and capital expenditures.
- 3. Analyze Results Instantly: The DCF model automatically computes intrinsic value and NPV.
- 4. Explore Scenarios: Evaluate various forecasts to assess different valuation results.
- 5. Present with Confidence: Deliver professional valuation insights to substantiate your decisions.
Why Opt for This Calculator?
- User-Friendly and Accessible: Ideal for both novices and seasoned professionals.
- Customizable Inputs: Easily adjust variables to tailor your analysis.
- Real-Time Updates: Observe immediate changes to The Swatch Group AG’s valuation as you tweak inputs.
- Preconfigured Data: Comes preloaded with The Swatch Group AG’s actual financial information for swift evaluations.
- Relied Upon by Experts: Favored by investors and analysts for making informed choices.
Who Can Benefit from This Product?
- Investors: Evaluate Swatch Group AG's (0QM4L) valuation before making stock trades.
- CFOs and Financial Analysts: Enhance valuation processes and assess financial projections.
- Startup Founders: Discover how leading public firms like Swatch Group AG are valued.
- Consultants: Create comprehensive valuation reports for clients in need.
- Students and Educators: Utilize real-world data to learn and teach valuation methodologies.
Contents of the Template
- Preloaded SWG Data: Historical and projected financial data, such as revenue, EBIT, and capital expenditures.
- DCF and WACC Models: Professional-grade spreadsheets designed for calculating intrinsic value and Weighted Average Cost of Capital.
- Editable Inputs: Yellow-highlighted cells for customizing revenue growth, tax rates, and discount rates.
- Financial Statements: Detailed annual and quarterly financial reports for thorough analysis.
- Key Ratios: Metrics for profitability, leverage, and efficiency to assess performance.
- Dashboard and Charts: Visual overviews of valuation results and underlying assumptions.
Disclaimer
All information, articles, and product details provided on this website are for general informational and educational purposes only. We do not claim any ownership over, nor do we intend to infringe upon, any trademarks, copyrights, logos, brand names, or other intellectual property mentioned or depicted on this site. Such intellectual property remains the property of its respective owners, and any references here are made solely for identification or informational purposes, without implying any affiliation, endorsement, or partnership.
We make no representations or warranties, express or implied, regarding the accuracy, completeness, or suitability of any content or products presented. Nothing on this website should be construed as legal, tax, investment, financial, medical, or other professional advice. In addition, no part of this site—including articles or product references—constitutes a solicitation, recommendation, endorsement, advertisement, or offer to buy or sell any securities, franchises, or other financial instruments, particularly in jurisdictions where such activity would be unlawful.
All content is of a general nature and may not address the specific circumstances of any individual or entity. It is not a substitute for professional advice or services. Any actions you take based on the information provided here are strictly at your own risk. You accept full responsibility for any decisions or outcomes arising from your use of this website and agree to release us from any liability in connection with your use of, or reliance upon, the content or products found herein.