
|
Vaudoise -Versicherungen, die SA (0QN7.L) DCF -Bewertung abhalten |
Fully Editable: Tailor To Your Needs In Excel Or Sheets
Professional Design: Trusted, Industry-Standard Templates
Investor-Approved Valuation Models
MAC/PC Compatible, Fully Unlocked
No Expertise Is Needed; Easy To Follow
Vaudoise Assurances Holding SA (0QN7.L) Bundle
Möchten Sie den inneren Wert von Vaudoise -Zusicherungen beurteilen, die SA halten? Unser (0QN7L) DCF-Taschenrechner integriert reale Daten mit umfassenden Anpassungsfunktionen, sodass Sie Prognosen anpassen und Ihre Anlagestrategien verbessern können.
What You Will Receive
- Customizable Excel Template: A fully adjustable Excel-based DCF Calculator featuring pre-filled real Vaudoise Assurances Holding SA (0QN7L) financials.
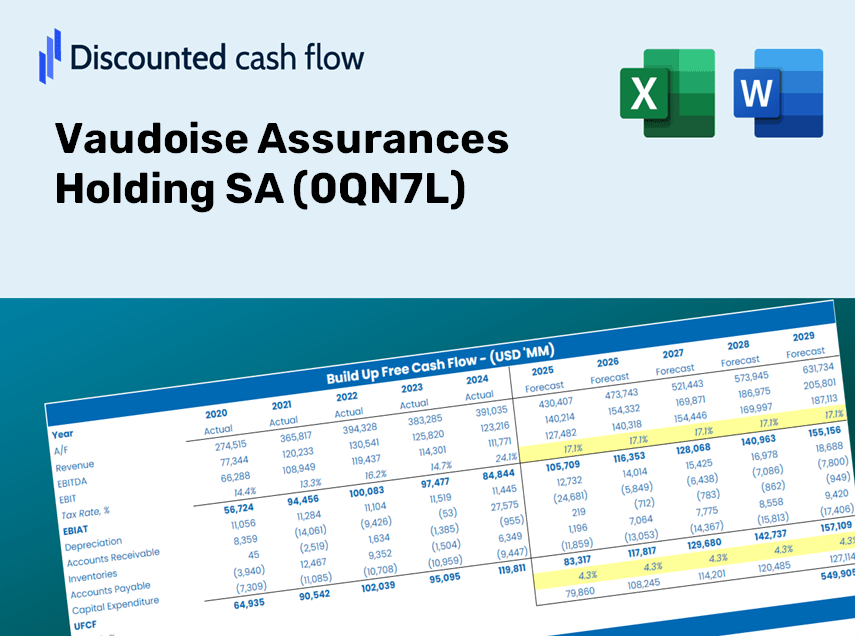
- Authentic Data: Access to historical figures and forward-looking projections (highlighted in the yellow cells).
- Adjustable Forecasts: Modify forecast variables such as revenue growth, EBITDA percentage, and WACC.
- Instant Calculations: Quickly observe how your inputs influence the valuation of Vaudoise Assurances Holding SA (0QN7L).
- Professional Resource: Designed for investors, CFOs, consultants, and financial analysts.
- Intuitive Layout: Organized for clarity and user-friendliness, complete with step-by-step guidance.
Key Features
- Pre-Loaded Data: Vaudoise Assurances Holding SA’s historical financial statements and pre-filled forecasts.
- Fully Adjustable Inputs: Modify WACC, tax rates, revenue growth, and EBITDA margins as needed.
- Instant Results: View the intrinsic value of Vaudoise Assurances Holding SA (0QN7L) recalculated in real-time.
- Clear Visual Outputs: Dashboard charts present valuation results and essential metrics effectively.
- Built for Accuracy: A professional-grade tool designed for analysts, investors, and finance professionals.
How It Works
- Step 1: Download the prebuilt Excel template featuring Vaudoise Assurances Holding SA's (0QN7L) data.
- Step 2: Review the pre-filled sheets to familiarize yourself with the essential metrics.
- Step 3: Modify forecasts and assumptions in the editable yellow cells (WACC, growth, margins).
- Step 4: Instantly see recalculated results, including the intrinsic value of Vaudoise Assurances Holding SA (0QN7L).
- Step 5: Make well-informed investment choices or generate reports based on the outputs.
Why Choose This Calculator for Vaudoise Assurances Holding SA (0QN7L)?
- Designed for Experts: A sophisticated tool tailored for analysts, CFOs, and insurance consultants.
- Accurate Data: Contains Vaudoise’s historical and projected financials for reliable insights.
- Flexible Scenario Analysis: Easily test various forecasts and assumptions to assess performance.
- Comprehensive Results: Automatically computes intrinsic value, NPV, and essential financial metrics.
- User-Friendly: Detailed step-by-step guidelines ensure a smooth navigation experience.
Who Can Benefit from This Product?
- Finance Students: Master valuation techniques and apply them to real data.
- Academics: Integrate professional models into your teaching or research initiatives.
- Investors: Evaluate your assumptions and assess valuation results for Vaudoise Assurances Holding SA (0QN7L).
- Analysts: Enhance your efficiency with a customizable, pre-built DCF model.
- Small Business Owners: Discover how major public companies like Vaudoise Assurances Holding SA (0QN7L) are evaluated.
Contents of the Template
- Pre-Filled DCF Model: Vaudoise Assurances Holding SA’s financial data preloaded for immediate application.
- WACC Calculator: In-depth calculations for Weighted Average Cost of Capital.
- Financial Ratios: Assess Vaudoise Assurances Holding SA’s profitability, leverage, and efficiency metrics.
- Editable Inputs: Adjust assumptions like growth rates, margins, and CAPEX to suit your specific scenarios.
- Financial Statements: Annual and quarterly reports to facilitate comprehensive analysis.
- Interactive Dashboard: Effortlessly visualize key valuation metrics and outcomes.
Disclaimer
All information, articles, and product details provided on this website are for general informational and educational purposes only. We do not claim any ownership over, nor do we intend to infringe upon, any trademarks, copyrights, logos, brand names, or other intellectual property mentioned or depicted on this site. Such intellectual property remains the property of its respective owners, and any references here are made solely for identification or informational purposes, without implying any affiliation, endorsement, or partnership.
We make no representations or warranties, express or implied, regarding the accuracy, completeness, or suitability of any content or products presented. Nothing on this website should be construed as legal, tax, investment, financial, medical, or other professional advice. In addition, no part of this site—including articles or product references—constitutes a solicitation, recommendation, endorsement, advertisement, or offer to buy or sell any securities, franchises, or other financial instruments, particularly in jurisdictions where such activity would be unlawful.
All content is of a general nature and may not address the specific circumstances of any individual or entity. It is not a substitute for professional advice or services. Any actions you take based on the information provided here are strictly at your own risk. You accept full responsibility for any decisions or outcomes arising from your use of this website and agree to release us from any liability in connection with your use of, or reliance upon, the content or products found herein.