
|
Huber+Suhner AG (0qnh.l) DCF -Bewertung |
Fully Editable: Tailor To Your Needs In Excel Or Sheets
Professional Design: Trusted, Industry-Standard Templates
Investor-Approved Valuation Models
MAC/PC Compatible, Fully Unlocked
No Expertise Is Needed; Easy To Follow
Huber+Suhner AG (0QNH.L) Bundle
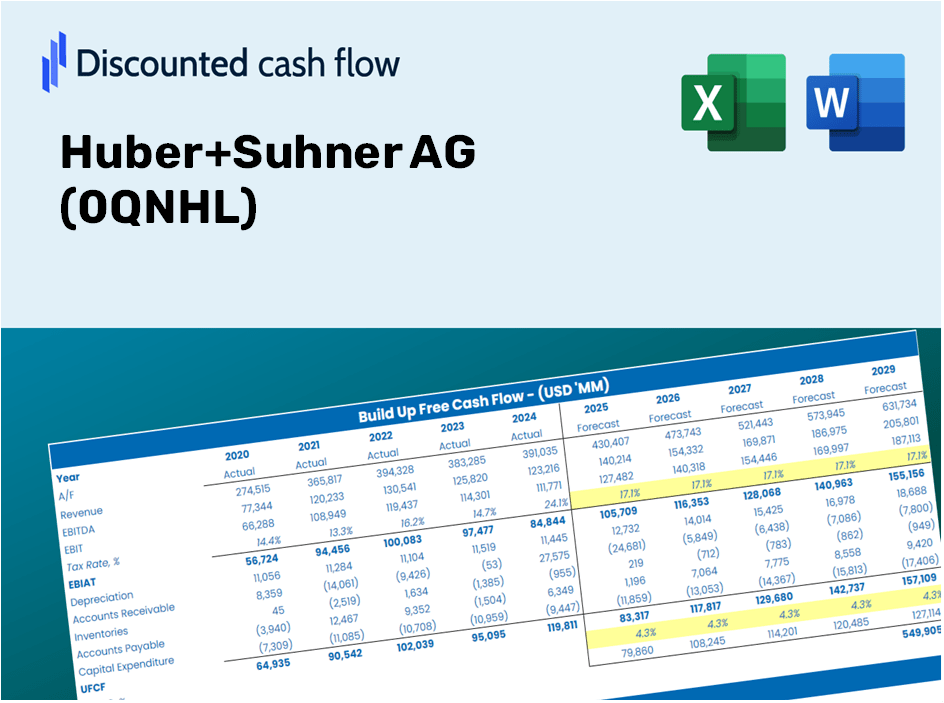
Vereinfachen Sie die Bewertung der Huber+Suhner Ag (0QNHL) mit diesem anpassbaren DCF -Taschenrechner! Mit echten Huber+Suhner AG (0QNHL) Finanzdaten und einstellbaren Prognoseeingaben können Sie Szenarien testen und Huber+Suhner AG (0QNHL) in wenigen Minuten aufdecken.
What You Will Receive
- Authentic Huber+Suhner Data: Comprehensive financials – including revenue and EBIT – derived from actual and forecasted figures.
- Complete Customization: Modify essential parameters (highlighted cells) such as WACC, growth percentage, and tax rates.
- Immediate Valuation Updates: Automatic recalculations for assessing the impact of changes on Huber+Suhner AG’s fair value.
- Flexible Excel Template: Designed for easy modifications, scenario analysis, and thorough projections.
- Efficient and Precise: Avoid the hassle of building models from scratch while ensuring accuracy and adaptability.
Key Features
- Accurate Huber+Suhner Financials: Gain access to reliable pre-loaded historical data and future forecasts.
- Adjustable Forecast Inputs: Modify the yellow-highlighted fields such as WACC, growth rates, and profit margins.
- Real-Time Calculations: Automatic recalculations for DCF, Net Present Value (NPV), and cash flow assessments.
- User-Friendly Dashboard: Intuitive charts and summaries to help visualize your valuation outcomes.
- Designed for All Experience Levels: A straightforward, easy-to-navigate platform for investors, CFOs, and consultants alike.
How It Functions
- Step 1: Download the Excel spreadsheet.
- Step 2: Examine the pre-filled Huber+Suhner AG (0QNHL) data (both historical and forecasted).
- Step 3: Modify key assumptions (highlighted in yellow) according to your findings.
- Step 4: Observe the automatic updates for Huber+Suhner AG’s intrinsic value.
- Step 5: Utilize the results for your investment strategies or reporting purposes.
Why Choose This Calculator for Huber+Suhner AG (0QNHL)?
- User-Friendly Design: Tailored for both novice users and seasoned professionals.
- Customizable Inputs: Adjust parameters effortlessly to suit your analysis needs.
- Real-Time Updates: Instantly view changes to Huber+Suhner AG's valuation as you modify inputs.
- Preloaded Data: Comes equipped with Huber+Suhner AG's actual financial figures for immediate analysis.
- Preferred by Experts: Widely utilized by investors and analysts for making informed choices.
Who Can Benefit from Huber+Suhner AG (0QNHL)?
- Investors: Gain confidence in your investment choices with a top-tier valuation tool.
- Financial Analysts: Enhance efficiency with a customizable, pre-designed DCF model at your disposal.
- Consultants: Easily modify the template for impactful client presentations or detailed reports.
- Finance Enthusiasts: Expand your knowledge of valuation strategies through real-life case studies.
- Educators and Students: Utilize this as a hands-on resource for finance-related educational programs.
Contents of the Template
- Pre-Filled DCF Model: Huber+Suhner AG’s financial data preloaded for immediate application.
- WACC Calculator: Comprehensive calculations for Weighted Average Cost of Capital.
- Financial Ratios: Assess Huber+Suhner AG's profitability, leverage, and efficiency metrics.
- Editable Inputs: Modify assumptions such as growth rates, margins, and CAPEX to suit your scenarios.
- Financial Statements: Annual and quarterly reports for thorough analysis.
- Interactive Dashboard: Effortlessly visualize essential valuation metrics and outcomes.
Disclaimer
All information, articles, and product details provided on this website are for general informational and educational purposes only. We do not claim any ownership over, nor do we intend to infringe upon, any trademarks, copyrights, logos, brand names, or other intellectual property mentioned or depicted on this site. Such intellectual property remains the property of its respective owners, and any references here are made solely for identification or informational purposes, without implying any affiliation, endorsement, or partnership.
We make no representations or warranties, express or implied, regarding the accuracy, completeness, or suitability of any content or products presented. Nothing on this website should be construed as legal, tax, investment, financial, medical, or other professional advice. In addition, no part of this site—including articles or product references—constitutes a solicitation, recommendation, endorsement, advertisement, or offer to buy or sell any securities, franchises, or other financial instruments, particularly in jurisdictions where such activity would be unlawful.
All content is of a general nature and may not address the specific circumstances of any individual or entity. It is not a substitute for professional advice or services. Any actions you take based on the information provided here are strictly at your own risk. You accept full responsibility for any decisions or outcomes arising from your use of this website and agree to release us from any liability in connection with your use of, or reliance upon, the content or products found herein.