
|
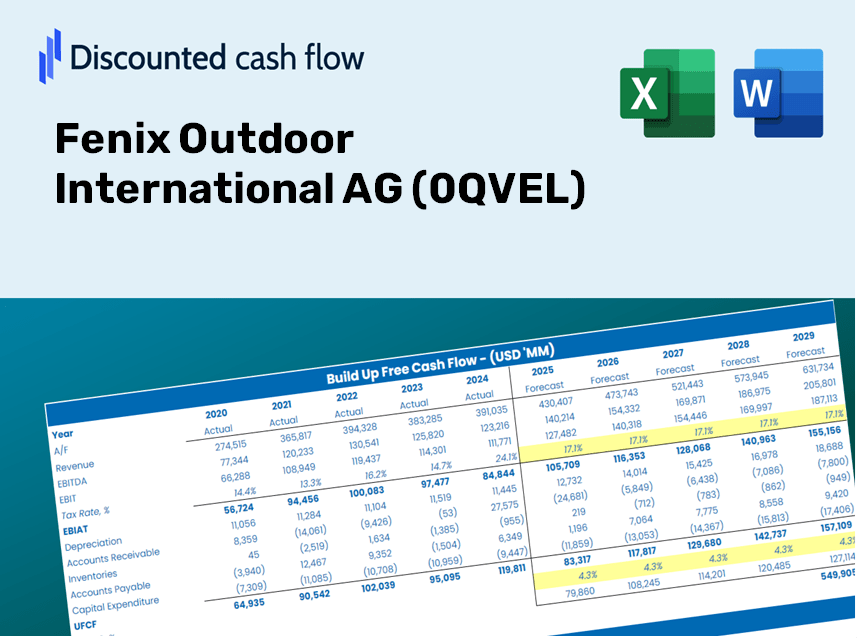
Fenix Outdoor International AG (0QVE.L) DCF -Bewertung |
Fully Editable: Tailor To Your Needs In Excel Or Sheets
Professional Design: Trusted, Industry-Standard Templates
Investor-Approved Valuation Models
MAC/PC Compatible, Fully Unlocked
No Expertise Is Needed; Easy To Follow
Fenix Outdoor International AG (0QVE.L) Bundle
Unser (0qvel) DCF-Taschenrechner entwickelt für Genauigkeit und ermöglicht es Ihnen, die Bewertung von Fenix Outdoor International AG mithilfe realer Finanzdaten zu bewerten, um alle wesentlichen Parameter für verbesserte Projektionen zu ändern.
What You Will Receive
- Authentic Fenix Outdoor Data: Comprehensive financials – from revenue to EBIT – derived from actual and projected numbers.
- Complete Customization: Modify all essential parameters (yellow cells) such as WACC, growth %, and tax rates.
- Immediate Valuation Adjustments: Automatic recalculations to evaluate the effects of changes on Fenix Outdoor's fair value.
- Flexible Excel Template: Designed for quick modifications, scenario analysis, and in-depth projections.
- Efficient and Precise: Avoid the hassle of building models from the ground up while ensuring accuracy and adaptability.
Key Features
- Pre-Loaded Data: Fenix Outdoor International AG’s historical financial statements and pre-filled forecasts.
- Fully Adjustable Inputs: Customize WACC, tax rates, revenue growth, and EBITDA margins.
- Instant Results: Observe the intrinsic value of Fenix Outdoor International AG recalculate in real time.
- Clear Visual Outputs: Dashboard charts showcase valuation results and key metrics.
- Built for Accuracy: A professional tool designed for analysts, investors, and finance professionals.
How It Works
- Download the Template: Gain immediate access to the Excel-based Fenix Outdoor DCF Calculator for (0QVEL).
- Input Your Assumptions: Modify the yellow-highlighted cells to reflect growth rates, WACC, margins, and more.
- Instant Calculations: The model will automatically refresh to display Fenix Outdoor's intrinsic value.
- Test Scenarios: Explore various assumptions to assess potential fluctuations in valuation.
- Analyze and Decide: Leverage the results to inform your investment or financial strategy.
Why Choose the Fenix Outdoor Calculator?
- Save Time: Skip the hassle of building a DCF model from the ground up – it's ready for immediate use.
- Enhance Precision: Dependable financial data and formulas minimize valuation inaccuracies.
- Completely Customizable: Adjust the model to align with your unique assumptions and forecasts.
- User-Friendly: Intuitive charts and outputs ensure straightforward analysis of results.
- Preferred by Professionals: Created for industry experts who prioritize accuracy and user experience.
Who Can Benefit from This Product?
- Investors: Accurately assess the fair value of Fenix Outdoor International AG (0QVEL) before making investment choices.
- CFOs: Utilize a professional-grade DCF model for comprehensive financial reporting and analysis.
- Consultants: Efficiently customize the template for client valuation reports.
- Entrepreneurs: Acquire valuable insights into financial modeling strategies employed by leading companies.
- Educators: Apply it as an instructional resource to illustrate various valuation techniques.
Contents of the Template
- Comprehensive DCF Model: An editable template featuring intricate valuation computations.
- Real-World Data: Fenix Outdoor International AG’s historical and forecasted financials preloaded for your analysis.
- Customizable Parameters: Modify WACC, growth rates, and tax assumptions to explore various scenarios.
- Financial Statements: Detailed annual and quarterly breakdowns for enhanced insights.
- Key Ratios: Integrated analysis for profitability, efficiency, and leverage metrics.
- Dashboard with Visual Outputs: Provides charts and tables for concise, actionable insights.
Disclaimer
All information, articles, and product details provided on this website are for general informational and educational purposes only. We do not claim any ownership over, nor do we intend to infringe upon, any trademarks, copyrights, logos, brand names, or other intellectual property mentioned or depicted on this site. Such intellectual property remains the property of its respective owners, and any references here are made solely for identification or informational purposes, without implying any affiliation, endorsement, or partnership.
We make no representations or warranties, express or implied, regarding the accuracy, completeness, or suitability of any content or products presented. Nothing on this website should be construed as legal, tax, investment, financial, medical, or other professional advice. In addition, no part of this site—including articles or product references—constitutes a solicitation, recommendation, endorsement, advertisement, or offer to buy or sell any securities, franchises, or other financial instruments, particularly in jurisdictions where such activity would be unlawful.
All content is of a general nature and may not address the specific circumstances of any individual or entity. It is not a substitute for professional advice or services. Any actions you take based on the information provided here are strictly at your own risk. You accept full responsibility for any decisions or outcomes arising from your use of this website and agree to release us from any liability in connection with your use of, or reliance upon, the content or products found herein.