
|
NP3 Fastigheter AB (0R43.L) DCF -Bewertung |
Fully Editable: Tailor To Your Needs In Excel Or Sheets
Professional Design: Trusted, Industry-Standard Templates
Investor-Approved Valuation Models
MAC/PC Compatible, Fully Unlocked
No Expertise Is Needed; Easy To Follow
NP3 Fastigheter AB (publ) (0R43.L) Bundle
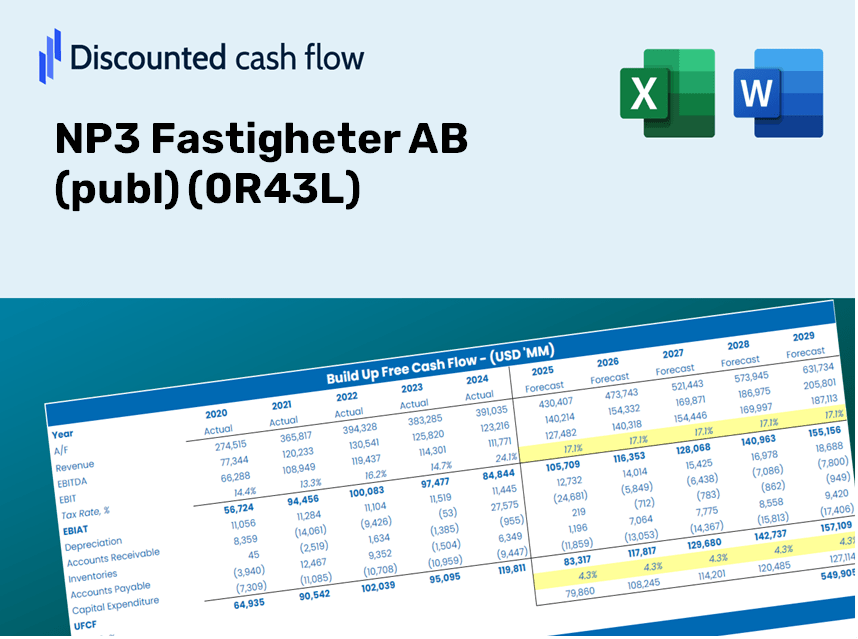
Als Investor oder Analyst dient dieser DCF-Taschenrechner von NP3 Fastigheter AB (publ) (0R43L) als Anlaufstelle für eine genaue Bewertung. Mit realen Daten von NP3 Fastigheter AB können Sie Prognosen anpassen und die Auswirkungen sofort beobachten.
Discounted Cash Flow (DCF) - (USD MM)
| Year | AY1 2020 |
AY2 2021 |
AY3 2022 |
AY4 2023 |
AY5 2024 |
FY1 2025 |
FY2 2026 |
FY3 2027 |
FY4 2028 |
FY5 2029 |
|---|---|---|---|---|---|---|---|---|---|---|
| Revenue | 1,091.0 | 1,238.0 | 1,551.0 | 1,797.0 | 1,992.0 | 2,099.6 | 2,213.0 | 2,332.5 | 2,458.5 | 2,591.3 |
| Revenue Growth, % | 0 | 13.47 | 25.28 | 15.86 | 10.85 | 5.4 | 5.4 | 5.4 | 5.4 | 5.4 |
| EBITDA | 766.0 | 859.0 | 1,556.0 | 1,285.0 | 1,432.0 | 1,608.3 | 1,695.1 | 1,786.7 | 1,883.2 | 1,984.9 |
| EBITDA, % | 70.21 | 69.39 | 100.32 | 71.51 | 71.89 | 76.6 | 76.6 | 76.6 | 76.6 | 76.6 |
| Depreciation | 327.0 | 383.0 | 470.0 | 6.0 | 6.0 | 385.7 | 406.5 | 428.5 | 451.6 | 476.0 |
| Depreciation, % | 29.97 | 30.94 | 30.3 | 0.33389 | 0.3012 | 18.37 | 18.37 | 18.37 | 18.37 | 18.37 |
| EBIT | 439.0 | 476.0 | 1,086.0 | 1,279.0 | 1,426.0 | 1,223.9 | 1,290.0 | 1,359.7 | 1,433.2 | 1,510.6 |
| EBIT, % | 40.24 | 38.45 | 70.02 | 71.17 | 71.59 | 58.29 | 58.29 | 58.29 | 58.29 | 58.29 |
| Total Cash | 119.0 | 272.0 | 213.0 | 696.0 | 245.0 | 410.0 | 432.2 | 455.5 | 480.1 | 506.0 |
| Total Cash, percent | .0 | .0 | .0 | .0 | .0 | .0 | .0 | .0 | .0 | .0 |
| Account Receivables | 47.0 | 75.0 | 76.0 | 79.0 | 213.0 | 127.5 | 134.4 | 141.6 | 149.3 | 157.3 |
| Account Receivables, % | 4.31 | 6.06 | 4.9 | 4.4 | 10.69 | 6.07 | 6.07 | 6.07 | 6.07 | 6.07 |
| Inventories | 30.0 | .0 | .0 | .0 | .0 | 11.5 | 12.2 | 12.8 | 13.5 | 14.3 |
| Inventories, % | 2.75 | 0 | 0 | 0 | 0 | 0.54995 | 0.54995 | 0.54995 | 0.54995 | 0.54995 |
| Accounts Payable | .0 | .0 | .0 | .0 | .0 | .0 | .0 | .0 | .0 | .0 |
| Accounts Payable, % | 0 | 0 | 0 | 0 | 0 | 0 | 0 | 0 | 0 | 0 |
| Capital Expenditure | -195.0 | .0 | .0 | .0 | .0 | -75.1 | -79.1 | -83.4 | -87.9 | -92.6 |
| Capital Expenditure, % | -17.87 | 0 | 0 | 0 | 0 | -3.57 | -3.57 | -3.57 | -3.57 | -3.57 |
| Tax Rate, % | 23.26 | 23.26 | 23.26 | 23.26 | 23.26 | 23.26 | 23.26 | 23.26 | 23.26 | 23.26 |
| EBITAT | 351.1 | 389.5 | 844.0 | 39,649.0 | 1,094.3 | 1,018.9 | 1,074.0 | 1,132.0 | 1,193.1 | 1,257.6 |
| Depreciation | ||||||||||
| Changes in Account Receivables | ||||||||||
| Changes in Inventories | ||||||||||
| Changes in Accounts Payable | ||||||||||
| Capital Expenditure | ||||||||||
| UFCF | 406.1 | 774.5 | 1,313.0 | 39,652.0 | 966.3 | 1,403.6 | 1,393.9 | 1,469.2 | 1,548.5 | 1,632.2 |
| WACC, % | 7.92 | 7.96 | 7.87 | 8.35 | 7.85 | 7.99 | 7.99 | 7.99 | 7.99 | 7.99 |
| PV UFCF | ||||||||||
| SUM PV UFCF | 5,911.7 | |||||||||
| Long Term Growth Rate, % | 2.90 | |||||||||
| Free cash flow (T + 1) | 1,680 | |||||||||
| Terminal Value | 33,003 | |||||||||
| Present Terminal Value | 22,472 | |||||||||
| Enterprise Value | 28,384 | |||||||||
| Net Debt | 12,637 | |||||||||
| Equity Value | 15,747 | |||||||||
| Diluted Shares Outstanding, MM | 59 | |||||||||
| Equity Value Per Share | 266.29 |
Benefits You Will Receive
- Authentic NP3 Financials: Access comprehensive historical and projected data for precise valuation.
- Customizable Inputs: Adjust WACC, tax rates, revenue growth, and capital expenditures to fit your analysis.
- Real-Time Calculations: Obtain dynamic calculations for intrinsic value and NPV.
- Scenario Testing: Explore various scenarios to assess the future performance of NP3 Fastigheter AB (publ) (0R43L).
- User-Friendly Interface: Designed for professionals but easy enough for newcomers to navigate.
Key Features
- 🔍 Real-Life NP3 Fastigheter Financials: Pre-filled historical and projected data for NP3 Fastigheter AB (publ) (0R43L).
- ✏️ Fully Customizable Inputs: Adjust all key parameters (yellow cells) such as WACC, growth %, and tax rates.
- 📊 Professional DCF Valuation: Built-in formulas calculate NP3 Fastigheter's intrinsic value using the Discounted Cash Flow method.
- ⚡ Instant Results: Visualize NP3 Fastigheter's valuation immediately after making adjustments.
- Scenario Analysis: Evaluate and compare outcomes for different financial assumptions side-by-side.
How It Functions
- Download: Get the pre-prepared Excel file containing NP3 Fastigheter AB (publ) (0R43L) financial data.
- Customize: Modify projections, such as revenue growth, EBITDA percentage, and WACC.
- Update Instantly: The intrinsic value and NPV calculations refresh in real-time.
- Test Scenarios: Generate various projections and compare results seamlessly.
- Make Informed Decisions: Utilize the valuation findings to shape your investment approach.
Why Opt for NP3 Fastigheter AB's Calculator?
- Precision: Utilizes real NP3 Fastigheter AB (0R43L) financial data for reliable results.
- Adaptability: Built for users to easily test and adjust inputs as needed.
- Efficiency: Eliminate the complexity of creating a DCF model from the ground up.
- Expert Quality: Crafted with the expertise and usability expected at the CFO level.
- Intuitive Design: Straightforward to navigate, even for those without in-depth financial modeling skills.
Who Can Benefit from This Product?
- Professional Investors: Create comprehensive and trustworthy valuation models for portfolio assessments related to NP3 Fastigheter AB (0R43L).
- Corporate Finance Teams: Evaluate valuation scenarios to inform and refine internal strategies for NP3 Fastigheter AB (0R43L).
- Consultants and Advisors: Deliver precise valuation insights for clients focused on NP3 Fastigheter AB (0R43L).
- Students and Educators: Utilize real-world data to enhance learning and practice in financial modeling pertaining to NP3 Fastigheter AB (0R43L).
- Real Estate Enthusiasts: Gain insights into how real estate companies like NP3 Fastigheter AB (0R43L) are valued in the market.
Contents of the Template
- Preloaded NP3 Data: Historical and projected financial metrics, including revenue, EBIT, and capital expenditures.
- DCF and WACC Models: Advanced templates for assessing intrinsic value and Weighted Average Cost of Capital.
- Customizable Inputs: Yellow-highlighted cells for modifying revenue growth, tax rates, and discount rates.
- Financial Statements: Detailed annual and quarterly financials for thorough analysis.
- Key Ratios: Profitability, leverage, and efficiency ratios for performance evaluation.
- Dashboard and Charts: Visual representations of valuation results and underlying assumptions.
Disclaimer
All information, articles, and product details provided on this website are for general informational and educational purposes only. We do not claim any ownership over, nor do we intend to infringe upon, any trademarks, copyrights, logos, brand names, or other intellectual property mentioned or depicted on this site. Such intellectual property remains the property of its respective owners, and any references here are made solely for identification or informational purposes, without implying any affiliation, endorsement, or partnership.
We make no representations or warranties, express or implied, regarding the accuracy, completeness, or suitability of any content or products presented. Nothing on this website should be construed as legal, tax, investment, financial, medical, or other professional advice. In addition, no part of this site—including articles or product references—constitutes a solicitation, recommendation, endorsement, advertisement, or offer to buy or sell any securities, franchises, or other financial instruments, particularly in jurisdictions where such activity would be unlawful.
All content is of a general nature and may not address the specific circumstances of any individual or entity. It is not a substitute for professional advice or services. Any actions you take based on the information provided here are strictly at your own risk. You accept full responsibility for any decisions or outcomes arising from your use of this website and agree to release us from any liability in connection with your use of, or reliance upon, the content or products found herein.