
|
Comet Holding AG (0ROQ.L) DCF -Bewertung |
Fully Editable: Tailor To Your Needs In Excel Or Sheets
Professional Design: Trusted, Industry-Standard Templates
Investor-Approved Valuation Models
MAC/PC Compatible, Fully Unlocked
No Expertise Is Needed; Easy To Follow
Comet Holding AG (0ROQ.L) Bundle
Verbessern Sie Ihre Anlagestrategien mit dem DCF -Taschenrechner der Comet Holding AG (0ROQL)! Erforschen Sie echte Finanzdaten, passen Sie Wachstumsprojektionen und -kosten an und beachten Sie sofort, wie sich diese Anpassungen auf den inneren Wert der Comet Holding AG (0ROQL) auswirken.
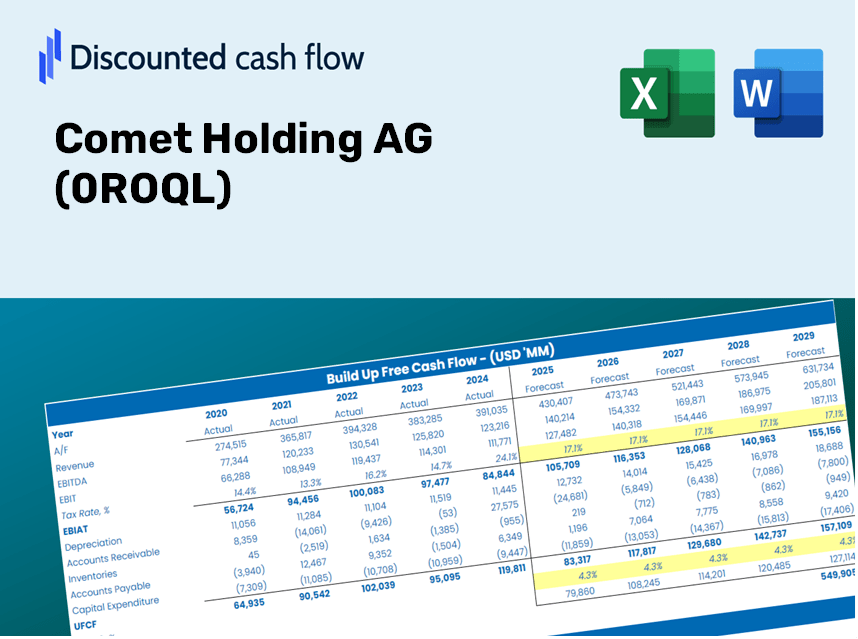
Discounted Cash Flow (DCF) - (USD MM)
| Year | AY1 2020 |
AY2 2021 |
AY3 2022 |
AY4 2023 |
AY5 2024 |
FY1 2025 |
FY2 2026 |
FY3 2027 |
FY4 2028 |
FY5 2029 |
|---|---|---|---|---|---|---|---|---|---|---|
| Revenue | 395.8 | 513.7 | 586.4 | 397.5 | 445.4 | 471.8 | 499.9 | 529.6 | 561.0 | 594.4 |
| Revenue Growth, % | 0 | 29.79 | 14.15 | -32.22 | 12.05 | 5.94 | 5.94 | 5.94 | 5.94 | 5.94 |
| EBITDA | 54.7 | 99.1 | 113.6 | 41.4 | 64.4 | 73.0 | 77.3 | 81.9 | 86.8 | 91.9 |
| EBITDA, % | 13.82 | 19.28 | 19.36 | 10.42 | 14.47 | 15.47 | 15.47 | 15.47 | 15.47 | 15.47 |
| Depreciation | 19.3 | 18.7 | 19.5 | 20.0 | 22.1 | 20.6 | 21.8 | 23.1 | 24.5 | 25.9 |
| Depreciation, % | 4.87 | 3.63 | 3.32 | 5.04 | 4.96 | 4.37 | 4.37 | 4.37 | 4.37 | 4.37 |
| EBIT | 35.4 | 80.4 | 94.1 | 21.4 | 42.3 | 52.4 | 55.5 | 58.8 | 62.3 | 66.0 |
| EBIT, % | 8.94 | 15.65 | 16.04 | 5.38 | 9.5 | 11.1 | 11.1 | 11.1 | 11.1 | 11.1 |
| Total Cash | 74.7 | 115.5 | 125.9 | 86.7 | 113.7 | 104.0 | 110.2 | 116.7 | 123.6 | 131.0 |
| Total Cash, percent | .0 | .0 | .0 | .0 | .0 | .0 | .0 | .0 | .0 | .0 |
| Account Receivables | 61.7 | 73.8 | 80.9 | 55.5 | 81.5 | 71.7 | 76.0 | 80.5 | 85.3 | 90.4 |
| Account Receivables, % | 15.6 | 14.37 | 13.8 | 13.95 | 18.3 | 15.2 | 15.2 | 15.2 | 15.2 | 15.2 |
| Inventories | 95.4 | 100.7 | 127.2 | 103.4 | 106.8 | 108.9 | 115.4 | 122.2 | 129.5 | 137.2 |
| Inventories, % | 24.1 | 19.61 | 21.69 | 26.02 | 23.98 | 23.08 | 23.08 | 23.08 | 23.08 | 23.08 |
| Accounts Payable | 26.7 | 26.1 | 31.2 | 20.3 | 30.8 | 27.5 | 29.2 | 30.9 | 32.7 | 34.7 |
| Accounts Payable, % | 6.75 | 5.08 | 5.32 | 5.12 | 6.91 | 5.84 | 5.84 | 5.84 | 5.84 | 5.84 |
| Capital Expenditure | -13.6 | -13.2 | -23.2 | -26.4 | -12.8 | -18.4 | -19.5 | -20.6 | -21.8 | -23.1 |
| Capital Expenditure, % | -3.43 | -2.57 | -3.96 | -6.65 | -2.87 | -3.89 | -3.89 | -3.89 | -3.89 | -3.89 |
| Tax Rate, % | 12.72 | 12.72 | 12.72 | 12.72 | 12.72 | 12.72 | 12.72 | 12.72 | 12.72 | 12.72 |
| EBITAT | 29.2 | 66.0 | 77.1 | 17.3 | 36.9 | 43.5 | 46.1 | 48.8 | 51.7 | 54.8 |
| Depreciation | ||||||||||
| Changes in Account Receivables | ||||||||||
| Changes in Inventories | ||||||||||
| Changes in Accounts Payable | ||||||||||
| Capital Expenditure | ||||||||||
| UFCF | -95.4 | 53.4 | 44.9 | 49.3 | 27.3 | 50.1 | 39.3 | 41.6 | 44.1 | 46.7 |
| WACC, % | 11.26 | 11.26 | 11.26 | 11.26 | 11.27 | 11.27 | 11.27 | 11.27 | 11.27 | 11.27 |
| PV UFCF | ||||||||||
| SUM PV UFCF | 163.2 | |||||||||
| Long Term Growth Rate, % | 3.50 | |||||||||
| Free cash flow (T + 1) | 48 | |||||||||
| Terminal Value | 623 | |||||||||
| Present Terminal Value | 365 | |||||||||
| Enterprise Value | 529 | |||||||||
| Net Debt | -16 | |||||||||
| Equity Value | 545 | |||||||||
| Diluted Shares Outstanding, MM | 8 | |||||||||
| Equity Value Per Share | 70.13 |
What You Will Receive
- Accurate Comet Holding AG (0ROQL) Financials: Access to both historical and projected data for precise valuation.
- Customizable Inputs: Adjust WACC, tax rates, revenue growth, and capital expenditures as needed.
- Real-time Calculations: Automatic computation of intrinsic value and NPV.
- Scenario Analysis: Explore various scenarios to assess the future performance of Comet Holding AG (0ROQL).
- User-Friendly Design: Designed for professionals while remaining accessible to newcomers.
Key Features
- Comprehensive DCF Calculator: Features in-depth unlevered and levered DCF valuation models tailored for Comet Holding AG (0ROQL).
- WACC Calculator: Ready-to-use Weighted Average Cost of Capital sheet with adjustable parameters for precise calculations.
- Customizable Forecast Assumptions: Alter growth rates, capital expenditures, and discount rates according to your analysis needs.
- Integrated Financial Ratios: Evaluate profitability, leverage, and efficiency ratios specifically for Comet Holding AG (0ROQL).
- Interactive Dashboard and Charts: Visual representations that highlight essential valuation metrics for streamlined analysis.
How It Works
- Step 1: Download the Excel file for Comet Holding AG (0ROQL).
- Step 2: Examine the pre-filled financial data and forecasts provided for Comet Holding AG (0ROQL).
- Step 3: Adjust key inputs such as revenue growth, WACC, and tax rates (highlighted cells) to reflect your assumptions.
- Step 4: Observe the DCF model update in real-time as you modify the inputs.
- Step 5: Review the output data and leverage the insights for your investment strategies regarding Comet Holding AG (0ROQL).
Why Select the Comet Holding AG Calculator?
- Time Efficient: Skip the hassle of building a DCF model from the ground up – it’s immediately available for use.
- Enhanced Accuracy: Dependable financial data and formulas minimize valuation errors.
- Completely Customizable: Adjust the model to align with your specific assumptions and forecasts.
- User-Friendly: Intuitive charts and outputs simplify result analysis.
- Endorsed by Professionals: Crafted for experts who prioritize precision and functionality.
Who Should Use This Product?
- Individual Investors: Gain insights to make informed decisions regarding the purchase or sale of Comet Holding AG (0ROQL) stock.
- Financial Analysts: Enhance your valuation processes with comprehensive financial models tailored for Comet Holding AG (0ROQL).
- Consultants: Provide clients with accurate and timely valuation analyses of Comet Holding AG (0ROQL).
- Business Owners: Learn from the valuation strategies of established companies like Comet Holding AG (0ROQL) to inform your own business approach.
- Finance Students: Develop your understanding of valuation methodologies using real examples and data from Comet Holding AG (0ROQL).
Contents of the Template
- Preloaded Comet Holding AG Data: Historical and projected financial metrics, including revenue, EBIT, and capital expenditures.
- DCF and WACC Models: Professional-grade spreadsheets for calculating intrinsic value and Weighted Average Cost of Capital.
- Editable Inputs: Cells highlighted in yellow for customizing revenue growth, tax rates, and discount rates.
- Financial Statements: Detailed annual and quarterly financial reports for in-depth analysis.
- Key Ratios: Assessment of profitability, leverage, and efficiency ratios to measure performance.
- Dashboard and Charts: Visual representations of valuation results and underlying assumptions.
Disclaimer
All information, articles, and product details provided on this website are for general informational and educational purposes only. We do not claim any ownership over, nor do we intend to infringe upon, any trademarks, copyrights, logos, brand names, or other intellectual property mentioned or depicted on this site. Such intellectual property remains the property of its respective owners, and any references here are made solely for identification or informational purposes, without implying any affiliation, endorsement, or partnership.
We make no representations or warranties, express or implied, regarding the accuracy, completeness, or suitability of any content or products presented. Nothing on this website should be construed as legal, tax, investment, financial, medical, or other professional advice. In addition, no part of this site—including articles or product references—constitutes a solicitation, recommendation, endorsement, advertisement, or offer to buy or sell any securities, franchises, or other financial instruments, particularly in jurisdictions where such activity would be unlawful.
All content is of a general nature and may not address the specific circumstances of any individual or entity. It is not a substitute for professional advice or services. Any actions you take based on the information provided here are strictly at your own risk. You accept full responsibility for any decisions or outcomes arising from your use of this website and agree to release us from any liability in connection with your use of, or reliance upon, the content or products found herein.