
|
HMS -Netzwerke AB (0RPZ.L) DCF -Bewertung |
Fully Editable: Tailor To Your Needs In Excel Or Sheets
Professional Design: Trusted, Industry-Standard Templates
Investor-Approved Valuation Models
MAC/PC Compatible, Fully Unlocked
No Expertise Is Needed; Easy To Follow
HMS Networks AB (publ) (0RPZ.L) Bundle
Optimieren Sie Ihre Zeit und verbessern Sie die Präzision mit unserem (0RPZL) DCF -Taschenrechner! Mit den tatsächlichen Daten von HMS Networks AB (Publ) und anpassbaren Annahmen ermöglichen dieses Tool Sie, HMS Networks AB (Publ) zu prognostizieren, zu analysieren und zu bewerten, genau wie ein erfahrener Investor.
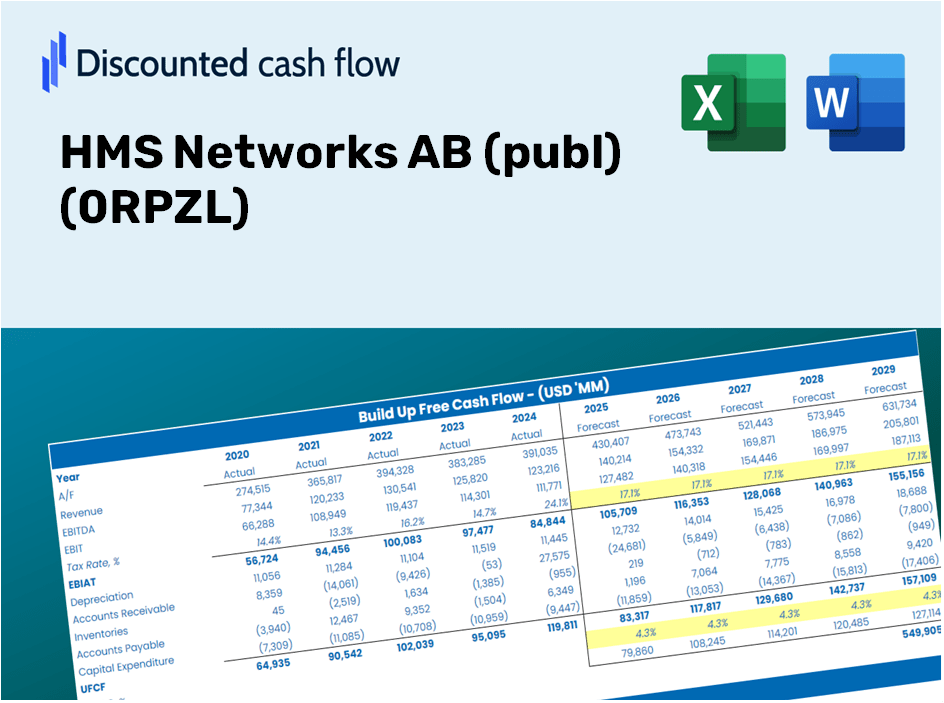
Discounted Cash Flow (DCF) - (USD MM)
| Year | AY1 2020 |
AY2 2021 |
AY3 2022 |
AY4 2023 |
AY5 2024 |
FY1 2025 |
FY2 2026 |
FY3 2027 |
FY4 2028 |
FY5 2029 |
|---|---|---|---|---|---|---|---|---|---|---|
| Revenue | 1,466.8 | 1,971.7 | 2,506.2 | 3,024.7 | 3,059.2 | 3,696.7 | 4,467.1 | 5,398.0 | 6,522.9 | 7,882.2 |
| Revenue Growth, % | 0 | 34.42 | 27.11 | 20.69 | 1.14 | 20.84 | 20.84 | 20.84 | 20.84 | 20.84 |
| EBITDA | 383.4 | 557.4 | 740.4 | 860.7 | 703.2 | 1,001.0 | 1,209.6 | 1,461.7 | 1,766.3 | 2,134.4 |
| EBITDA, % | 26.14 | 28.27 | 29.54 | 28.46 | 22.98 | 27.08 | 27.08 | 27.08 | 27.08 | 27.08 |
| Depreciation | 65.3 | 102.3 | 107.9 | 125.2 | 218.6 | 186.5 | 225.4 | 272.4 | 329.1 | 397.7 |
| Depreciation, % | 4.45 | 5.19 | 4.3 | 4.14 | 7.15 | 5.05 | 5.05 | 5.05 | 5.05 | 5.05 |
| EBIT | 318.2 | 455.0 | 632.6 | 735.5 | 484.5 | 814.5 | 984.2 | 1,189.3 | 1,437.2 | 1,736.7 |
| EBIT, % | 21.69 | 23.08 | 25.24 | 24.32 | 15.84 | 22.03 | 22.03 | 22.03 | 22.03 | 22.03 |
| Total Cash | 81.5 | 172.2 | 144.2 | 124.0 | 73.9 | 196.4 | 237.3 | 286.8 | 346.5 | 418.7 |
| Total Cash, percent | .0 | .0 | .0 | .0 | .0 | .0 | .0 | .0 | .0 | .0 |
| Account Receivables | 211.2 | 333.7 | 509.3 | 386.1 | 463.4 | 588.2 | 710.8 | 858.9 | 1,037.9 | 1,254.2 |
| Account Receivables, % | 14.4 | 16.93 | 20.32 | 12.77 | 15.15 | 15.91 | 15.91 | 15.91 | 15.91 | 15.91 |
| Inventories | 157.8 | 195.2 | 362.0 | 588.8 | 858.7 | 611.0 | 738.3 | 892.2 | 1,078.1 | 1,302.7 |
| Inventories, % | 10.76 | 9.9 | 14.45 | 19.47 | 28.07 | 16.53 | 16.53 | 16.53 | 16.53 | 16.53 |
| Accounts Payable | 91.0 | 164.6 | 243.0 | 250.3 | 143.1 | 275.0 | 332.4 | 401.6 | 485.3 | 586.4 |
| Accounts Payable, % | 6.2 | 8.35 | 9.69 | 8.27 | 4.68 | 7.44 | 7.44 | 7.44 | 7.44 | 7.44 |
| Capital Expenditure | -47.6 | -39.2 | -83.1 | -73.9 | -121.1 | -110.5 | -133.6 | -161.4 | -195.0 | -235.7 |
| Capital Expenditure, % | -3.25 | -1.99 | -3.31 | -2.44 | -3.96 | -2.99 | -2.99 | -2.99 | -2.99 | -2.99 |
| Tax Rate, % | 15.04 | 15.04 | 15.04 | 15.04 | 15.04 | 15.04 | 15.04 | 15.04 | 15.04 | 15.04 |
| EBITAT | 259.6 | 360.1 | 515.2 | 585.1 | 411.7 | 662.5 | 800.5 | 967.4 | 1,168.9 | 1,412.5 |
| Depreciation | ||||||||||
| Changes in Account Receivables | ||||||||||
| Changes in Inventories | ||||||||||
| Changes in Accounts Payable | ||||||||||
| Capital Expenditure | ||||||||||
| UFCF | -.8 | 336.9 | 276.0 | 540.1 | 55.0 | 993.3 | 699.8 | 845.6 | 1,021.8 | 1,234.8 |
| WACC, % | 8.48 | 8.47 | 8.48 | 8.47 | 8.5 | 8.48 | 8.48 | 8.48 | 8.48 | 8.48 |
| PV UFCF | ||||||||||
| SUM PV UFCF | 3,732.3 | |||||||||
| Long Term Growth Rate, % | 4.00 | |||||||||
| Free cash flow (T + 1) | 1,284 | |||||||||
| Terminal Value | 28,653 | |||||||||
| Present Terminal Value | 19,071 | |||||||||
| Enterprise Value | 22,804 | |||||||||
| Net Debt | 3,081 | |||||||||
| Equity Value | 19,722 | |||||||||
| Diluted Shares Outstanding, MM | 49 | |||||||||
| Equity Value Per Share | 403.58 |
What You Will Receive
- Genuine HMS Networks AB Financial Data: Comes pre-populated with historical and forecasted figures for accurate analysis.
- Completely Customizable Template: Easily adjust vital inputs such as revenue growth, WACC, and EBITDA %.
- Real-Time Calculations: Watch HMS Networks AB's intrinsic value change instantly as you make adjustments.
- Professional Valuation Tool: Tailored for investors, analysts, and consultants aiming for precise DCF outcomes.
- Intuitive Design: Clear layout and straightforward instructions suitable for all skill levels.
Key Features
- Accurate HMS Networks Financials: Gain access to reliable historical data and forecasts tailored for HMS Networks AB (publ) (0RPZL).
- Personalized Forecast Assumptions: Adjust editable, highlighted cells for key metrics like WACC, growth rates, and profit margins.
- Automated Calculations: Instantaneous updates to DCF, Net Present Value (NPV), and cash flow evaluations.
- Interactive Dashboard: User-friendly charts and summaries to help you interpret your valuation findings.
- Designed for All Experience Levels: A straightforward, intuitive format suitable for investors, CFOs, and consultants alike.
How It Works
- Step 1: Download the prebuilt Excel template featuring HMS Networks AB's (0RPZL) data.
- Step 2: Review the pre-populated sheets to familiarize yourself with the essential metrics.
- Step 3: Modify forecasts and assumptions in the editable yellow cells (WACC, growth, margins).
- Step 4: Immediately view the recalibrated results, highlighting HMS Networks AB's (0RPZL) intrinsic value.
- Step 5: Make well-informed investment decisions or create reports based on the generated outputs.
Why Choose This Calculator?
- User-Friendly Interface: Tailored for both novices and experienced users.
- Customizable Inputs: Adjust parameters effortlessly to suit your analysis.
- Real-Time Feedback: Watch immediate changes to HMS Networks AB (0RPZL)’s valuation as you modify inputs.
- Pre-Configured: Comes with HMS Networks AB (0RPZL)’s actual financial data for swift evaluations.
- Preferred by Experts: Utilized by investors and analysts for data-driven decision making.
Who Should Use This Product?
- Investors: Assess the fair value of HMS Networks AB (0RPZL) before making investment choices.
- CFOs: Utilize a top-tier DCF model for financial analysis and reporting.
- Consultants: Efficiently customize the template for client valuation reports.
- Entrepreneurs: Discover insights into financial modeling practices adopted by leading firms.
- Educators: Employ it as a resource to illustrate valuation techniques in the classroom.
What the Template Offers
- Comprehensive DCF Model: An editable template featuring in-depth valuation calculations.
- Real-World Data: Historical and projected financial information for HMS Networks AB (0RPZL) preloaded for your analysis.
- Customizable Parameters: Modify WACC, growth rates, and tax assumptions to explore different scenarios.
- Financial Statements: Detailed annual and quarterly data for enhanced insights.
- Key Ratios: Integrated analysis covering profitability, efficiency, and leverage metrics.
- Dashboard with Visual Outputs: Clear charts and tables providing actionable results.
Disclaimer
All information, articles, and product details provided on this website are for general informational and educational purposes only. We do not claim any ownership over, nor do we intend to infringe upon, any trademarks, copyrights, logos, brand names, or other intellectual property mentioned or depicted on this site. Such intellectual property remains the property of its respective owners, and any references here are made solely for identification or informational purposes, without implying any affiliation, endorsement, or partnership.
We make no representations or warranties, express or implied, regarding the accuracy, completeness, or suitability of any content or products presented. Nothing on this website should be construed as legal, tax, investment, financial, medical, or other professional advice. In addition, no part of this site—including articles or product references—constitutes a solicitation, recommendation, endorsement, advertisement, or offer to buy or sell any securities, franchises, or other financial instruments, particularly in jurisdictions where such activity would be unlawful.
All content is of a general nature and may not address the specific circumstances of any individual or entity. It is not a substitute for professional advice or services. Any actions you take based on the information provided here are strictly at your own risk. You accept full responsibility for any decisions or outcomes arising from your use of this website and agree to release us from any liability in connection with your use of, or reliance upon, the content or products found herein.