
|
EPIROC AB (0YYSU.L) DCF -Bewertung |
Fully Editable: Tailor To Your Needs In Excel Or Sheets
Professional Design: Trusted, Industry-Standard Templates
Investor-Approved Valuation Models
MAC/PC Compatible, Fully Unlocked
No Expertise Is Needed; Easy To Follow
Epiroc AB (publ) (0YSU.L) Bundle
Vereinfachen Sie die EPIROC AB (publ) (0YYSUL) Bewertung mit diesem anpassbaren DCF -Taschenrechner! Mit echten EPIROC AB (Publ) (0YSSUL) Finanzdaten und einstellbaren Prognoseeingaben können Sie Szenarien testen und EPIROC AB (Publ) (0YSSUL) in Minuten aufdecken.
Your Benefits
- Customizable Excel Template: A comprehensive Excel-based DCF Calculator featuring pre-populated financial data for Epiroc AB (publ) (0YSUL).
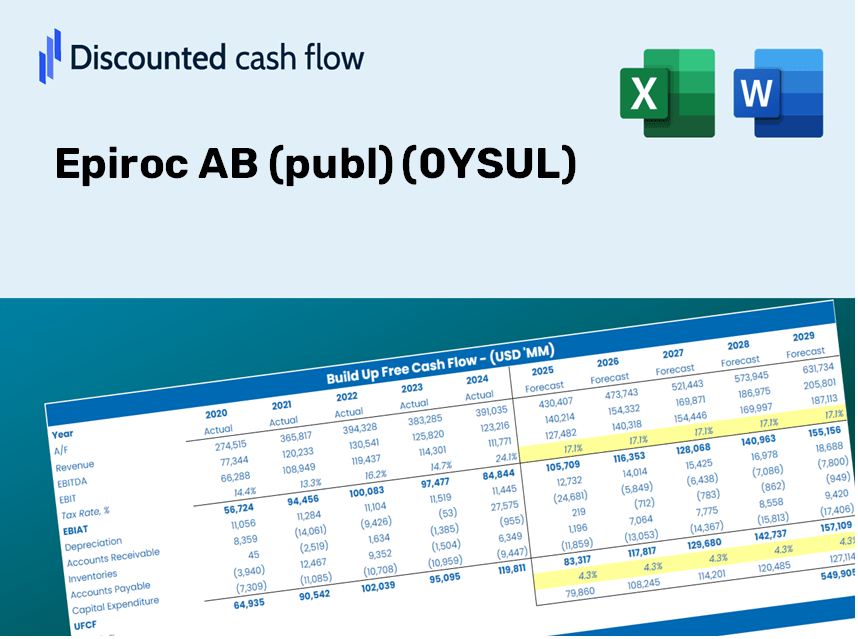
- Actual Market Data: Access to historical performance metrics and forward-looking projections (highlighted in the yellow cells).
- Forecast Customization: Adjust key assumptions such as revenue growth, EBITDA percentage, and WACC to fit your analysis.
- Instant Calculations: Quickly assess how changes in inputs affect the valuation of Epiroc AB (publ) (0YSUL).
- Professional-Grade Tool: Designed for investors, CFOs, consultants, and financial analysts.
- User-Friendly Interface: Organized for straightforward navigation, complete with step-by-step guidance.
Key Features
- 🔍 Real-Life Epiroc Financials: Pre-filled historical and projected data for Epiroc AB (publ) (0YSUL).
- ✏️ Fully Customizable Inputs: Modify all essential parameters (yellow cells) such as WACC, growth %, and tax rates.
- 📊 Professional DCF Valuation: Integrated formulas calculate Epiroc’s intrinsic value using the Discounted Cash Flow method.
- ⚡ Instant Results: Visualize Epiroc’s valuation immediately after applying changes.
- Scenario Analysis: Evaluate and compare different financial assumptions side-by-side.
How It Works
- Step 1: Download the Excel file.
- Step 2: Review the pre-filled Epiroc AB (publ) (0YSUL) data (historical and projected).
- Step 3: Modify the key assumptions (highlighted in yellow) according to your analysis.
- Step 4: Observe the automatic recalculations for Epiroc AB’s (publ) (0YSUL) intrinsic value.
- Step 5: Utilize the results for investment decisions or reporting purposes.
Why Choose the Epiroc AB (0YSUL) Calculator?
- Precision: Leverages accurate Epiroc financial data for dependable results.
- Versatility: Tailored for users to easily adjust and experiment with inputs.
- Efficiency: Avoid the complexity of creating a DCF model from the ground up.
- Expert-Level: Crafted with the attention to detail expected from top financial executives.
- Intuitive: Simple interface suitable for users with various levels of financial expertise.
Who Should Use This Product?
- Individual Investors: Make informed decisions regarding the purchase or sale of Epiroc AB (publ) (0YSUL) stock.
- Financial Analysts: Enhance valuation processes with accessible financial models tailored for Epiroc AB (publ) (0YSUL).
- Consultants: Provide clients with accurate and timely valuation insights on Epiroc AB (publ) (0YSUL).
- Business Owners: Gain an understanding of how major companies like Epiroc AB (publ) (0YSUL) are valued to inform your business strategies.
- Finance Students: Develop valuation skills utilizing real-world data and case studies related to Epiroc AB (publ) (0YSUL).
What the Template Contains
- Historical Data: Features Epiroc AB (publ)'s past financials and baseline forecasts.
- DCF and Levered DCF Models: Comprehensive templates for calculating Epiroc AB (publ)'s intrinsic value.
- WACC Sheet: Pre-configured calculations for Weighted Average Cost of Capital.
- Editable Inputs: Adjust critical drivers such as growth rates, EBITDA %, and CAPEX assumptions.
- Quarterly and Annual Statements: A thorough overview of Epiroc AB (publ)'s financials.
- Interactive Dashboard: Dynamically visualize valuation results and future projections.
Disclaimer
All information, articles, and product details provided on this website are for general informational and educational purposes only. We do not claim any ownership over, nor do we intend to infringe upon, any trademarks, copyrights, logos, brand names, or other intellectual property mentioned or depicted on this site. Such intellectual property remains the property of its respective owners, and any references here are made solely for identification or informational purposes, without implying any affiliation, endorsement, or partnership.
We make no representations or warranties, express or implied, regarding the accuracy, completeness, or suitability of any content or products presented. Nothing on this website should be construed as legal, tax, investment, financial, medical, or other professional advice. In addition, no part of this site—including articles or product references—constitutes a solicitation, recommendation, endorsement, advertisement, or offer to buy or sell any securities, franchises, or other financial instruments, particularly in jurisdictions where such activity would be unlawful.
All content is of a general nature and may not address the specific circumstances of any individual or entity. It is not a substitute for professional advice or services. Any actions you take based on the information provided here are strictly at your own risk. You accept full responsibility for any decisions or outcomes arising from your use of this website and agree to release us from any liability in connection with your use of, or reliance upon, the content or products found herein.