
|
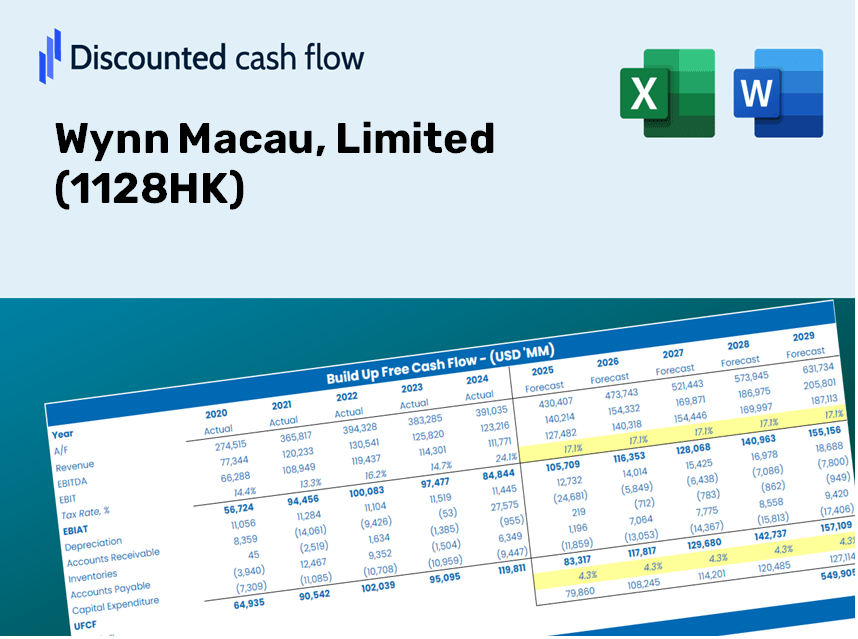
Wynn Macau, Limited (1128.HK) DCF -Bewertung |
Fully Editable: Tailor To Your Needs In Excel Or Sheets
Professional Design: Trusted, Industry-Standard Templates
Investor-Approved Valuation Models
MAC/PC Compatible, Fully Unlocked
No Expertise Is Needed; Easy To Follow
Wynn Macau, Limited (1128.HK) Bundle
Unabhängig davon, ob Sie ein Investor oder Analyst sind, dient dieser Wynn Macau, Limited (1128HK) DCF -Taschenrechner als wesentliches Werkzeug für eine genaue Bewertung. Mit den tatsächlichen Daten von Wynn Macaus können Sie Prognosen anpassen und die Auswirkungen sofort beobachten.
Discounted Cash Flow (DCF) - (USD MM)
| Year | AY1 2020 |
AY2 2021 |
AY3 2022 |
AY4 2023 |
AY5 2024 |
FY1 2025 |
FY2 2026 |
FY3 2027 |
FY4 2028 |
FY5 2029 |
|---|---|---|---|---|---|---|---|---|---|---|
| Revenue | 7,612.4 | 11,725.4 | 5,643.9 | 24,268.1 | 28,740.4 | 37,405.2 | 48,682.2 | 63,359.0 | 82,460.7 | 107,321.2 |
| Revenue Growth, % | 0 | 54.03 | -51.87 | 329.99 | 18.43 | 30.15 | 30.15 | 30.15 | 30.15 | 30.15 |
| EBITDA | -2,460.5 | -200.3 | -2,569.3 | 6,702.1 | 8,810.3 | -1,592.1 | -2,072.0 | -2,696.7 | -3,509.7 | -4,567.9 |
| EBITDA, % | -32.32 | -1.71 | -45.52 | 27.62 | 30.65 | -4.26 | -4.26 | -4.26 | -4.26 | -4.26 |
| Depreciation | 2,915.4 | 2,625.0 | 2,308.2 | 2,374.1 | 2,370.2 | 8,948.2 | 11,645.9 | 15,157.0 | 19,726.5 | 25,673.8 |
| Depreciation, % | 38.3 | 22.39 | 40.9 | 9.78 | 8.25 | 23.92 | 23.92 | 23.92 | 23.92 | 23.92 |
| EBIT | -5,375.9 | -2,825.3 | -4,877.5 | 4,328.0 | 6,440.1 | -10,540.3 | -13,718.0 | -17,853.7 | -23,236.3 | -30,241.6 |
| EBIT, % | -70.62 | -24.1 | -86.42 | 17.83 | 22.41 | -28.18 | -28.18 | -28.18 | -28.18 | -28.18 |
| Total Cash | 18,831.1 | 11,664.1 | 7,422.9 | 15,754.8 | 11,333.4 | 30,210.7 | 39,318.7 | 51,172.6 | 66,600.3 | 86,679.1 |
| Total Cash, percent | .0 | .0 | .0 | .0 | .0 | .0 | .0 | .0 | .0 | .0 |
| Account Receivables | 714.7 | 292.0 | 200.8 | 749.8 | 713.3 | 1,571.7 | 2,045.6 | 2,662.3 | 3,464.9 | 4,509.5 |
| Account Receivables, % | 9.39 | 2.49 | 3.56 | 3.09 | 2.48 | 4.2 | 4.2 | 4.2 | 4.2 | 4.2 |
| Inventories | 286.8 | 296.2 | 280.3 | 286.2 | 302.2 | 1,009.3 | 1,313.6 | 1,709.6 | 2,225.0 | 2,895.8 |
| Inventories, % | 3.77 | 2.53 | 4.97 | 1.18 | 1.05 | 2.7 | 2.7 | 2.7 | 2.7 | 2.7 |
| Accounts Payable | 438.5 | 393.6 | 400.5 | 456.5 | 410.0 | 1,460.4 | 1,900.7 | 2,473.7 | 3,219.5 | 4,190.1 |
| Accounts Payable, % | 5.76 | 3.36 | 7.1 | 1.88 | 1.43 | 3.9 | 3.9 | 3.9 | 3.9 | 3.9 |
| Capital Expenditure | -749.1 | -476.0 | -348.7 | -714.3 | -1,306.0 | -2,062.2 | -2,684.0 | -3,493.1 | -4,546.3 | -5,916.9 |
| Capital Expenditure, % | -9.84 | -4.06 | -6.18 | -2.94 | -4.54 | -5.51 | -5.51 | -5.51 | -5.51 | -5.51 |
| Tax Rate, % | 1.6 | 1.6 | 1.6 | 1.6 | 1.6 | 1.6 | 1.6 | 1.6 | 1.6 | 1.6 |
| EBITAT | -5,385.2 | -2,832.1 | -4,885.7 | 4,175.8 | 6,337.3 | -10,432.5 | -13,577.7 | -17,671.1 | -22,998.7 | -29,932.4 |
| Depreciation | ||||||||||
| Changes in Account Receivables | ||||||||||
| Changes in Inventories | ||||||||||
| Changes in Accounts Payable | ||||||||||
| Capital Expenditure | ||||||||||
| UFCF | -3,782.0 | -314.6 | -2,812.3 | 5,336.8 | 7,375.5 | -4,061.6 | -4,953.6 | -6,447.0 | -8,390.6 | -10,920.3 |
| WACC, % | 7.95 | 7.95 | 7.95 | 7.81 | 7.88 | 7.91 | 7.91 | 7.91 | 7.91 | 7.91 |
| PV UFCF | ||||||||||
| SUM PV UFCF | -26,803.3 | |||||||||
| Long Term Growth Rate, % | 2.00 | |||||||||
| Free cash flow (T + 1) | -11,139 | |||||||||
| Terminal Value | -188,612 | |||||||||
| Present Terminal Value | -128,929 | |||||||||
| Enterprise Value | -155,732 | |||||||||
| Net Debt | 33,644 | |||||||||
| Equity Value | -189,376 | |||||||||
| Diluted Shares Outstanding, MM | 5,696 | |||||||||
| Equity Value Per Share | -33.25 |
What You'll Receive
- Actual WYNN Financial Data: Featuring Wynn Macau's historical and projected figures for accurate assessments.
- Customizable Template: Easily adjust key metrics such as revenue growth, WACC, and EBITDA percentage.
- Instant Calculations: Watch the intrinsic value of Wynn Macau update in real-time as you modify inputs.
- Expert Valuation Tool: Tailored for investors, analysts, and consultants aiming for precise DCF outcomes.
- Intuitive Design: Simplified layout and straightforward instructions suitable for all skill levels.
Key Features
- Real-Life WYNN Data: Pre-filled with Wynn Macau's historical financial performance and future projections.
- Fully Customizable Inputs: Modify revenue growth rates, profit margins, WACC, tax rates, and capital expenditures as per your needs.
- Dynamic Valuation Model: Automatically updates Net Present Value (NPV) and intrinsic value based on your entered data.
- Scenario Testing: Create various forecast scenarios to explore different valuation possibilities.
- User-Friendly Design: Intuitive layout tailored for both professionals and novice users.
How It Operates
- Download: Get the pre-formatted Excel file featuring Wynn Macau, Limited's (1128HK) financial metrics.
- Customize: Modify projections such as revenue growth, EBITDA margin, and WACC.
- Update Automatically: Enjoy real-time updates for intrinsic value and NPV calculations.
- Test Scenarios: Analyze various projections and evaluate results instantly.
- Make Decisions: Leverage the valuation findings to inform your investment approach.
Reasons to Use the Wynn Macau Calculator
- Time-Saving: Skip the hassle of building a financial model from the ground up – our tool is ready for immediate use.
- Enhanced Accuracy: Dependable financial metrics and calculations minimize valuation errors.
- Completely Customizable: Adjust the model to suit your specific assumptions and forecasts.
- User-Friendly Design: Intuitive charts and outputs facilitate effortless analysis of results.
- Favored by Professionals: Crafted for experts who prioritize accuracy and functionality.
Who Can Benefit from This Product?
- Finance Students: Explore valuation methodologies and apply them with real-world data.
- Academics: Integrate industry-standard models into your teaching or research initiatives.
- Investors: Validate your investment hypotheses and assess valuation metrics for Wynn Macau, Limited (1128HK).
- Analysts: Enhance your workflow using a pre-designed, customizable DCF model.
- Small Business Owners: Discover how major public companies like Wynn Macau, Limited (1128HK) are assessed and valued.
Contents of the Template
- Comprehensive DCF Model: An editable template featuring detailed valuation calculations.
- Real-World Data: Wynn Macau, Limited’s historical and projected financials preloaded for in-depth analysis.
- Customizable Parameters: Modify WACC, growth rates, and tax assumptions to explore various scenarios.
- Financial Statements: Complete annual and quarterly breakdowns for enhanced insights.
- Key Ratios: Integrated analysis for profitability, efficiency, and leverage metrics.
- Dashboard with Visual Outputs: Clear charts and tables providing actionable results.
Disclaimer
All information, articles, and product details provided on this website are for general informational and educational purposes only. We do not claim any ownership over, nor do we intend to infringe upon, any trademarks, copyrights, logos, brand names, or other intellectual property mentioned or depicted on this site. Such intellectual property remains the property of its respective owners, and any references here are made solely for identification or informational purposes, without implying any affiliation, endorsement, or partnership.
We make no representations or warranties, express or implied, regarding the accuracy, completeness, or suitability of any content or products presented. Nothing on this website should be construed as legal, tax, investment, financial, medical, or other professional advice. In addition, no part of this site—including articles or product references—constitutes a solicitation, recommendation, endorsement, advertisement, or offer to buy or sell any securities, franchises, or other financial instruments, particularly in jurisdictions where such activity would be unlawful.
All content is of a general nature and may not address the specific circumstances of any individual or entity. It is not a substitute for professional advice or services. Any actions you take based on the information provided here are strictly at your own risk. You accept full responsibility for any decisions or outcomes arising from your use of this website and agree to release us from any liability in connection with your use of, or reliance upon, the content or products found herein.