
|
Yankuang Energy Group Company Limited (1171.HK) DCF -Bewertung |
Fully Editable: Tailor To Your Needs In Excel Or Sheets
Professional Design: Trusted, Industry-Standard Templates
Investor-Approved Valuation Models
MAC/PC Compatible, Fully Unlocked
No Expertise Is Needed; Easy To Follow
Yankuang Energy Group Company Limited (1171.HK) Bundle
Vereinfachen Sie die Bewertung der Yankuang Energy Group Company Limited mit diesem anpassbaren DCF -Taschenrechner! Mit Real Yankuang Energy Group Company Limited (1171HK) Finanzdaten und einstellbaren Prognoseeingängen können Sie Szenarien testen und die beizulegende Zeitwerte der Yankuang Energy Group Company Limited (1171HK) in Minuten aufdecken.
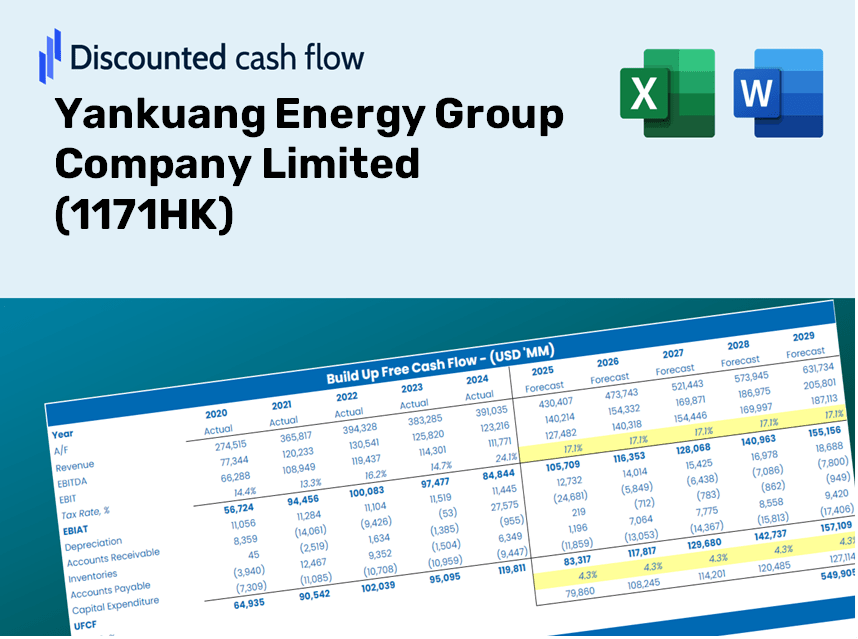
Discounted Cash Flow (DCF) - (USD MM)
| Year | AY1 2020 |
AY2 2021 |
AY3 2022 |
AY4 2023 |
AY5 2024 |
FY1 2025 |
FY2 2026 |
FY3 2027 |
FY4 2028 |
FY5 2029 |
|---|---|---|---|---|---|---|---|---|---|---|
| Revenue | 234,681.6 | 165,910.7 | 219,222.0 | 163,764.7 | 151,866.0 | 140,576.9 | 130,126.9 | 120,453.8 | 111,499.7 | 103,211.3 |
| Revenue Growth, % | 0 | -29.3 | 32.13 | -25.3 | -7.27 | -7.43 | -7.43 | -7.43 | -7.43 | -7.43 |
| EBITDA | 24,345.4 | 43,698.6 | 81,351.9 | 61,471.4 | 50,492.0 | 40,656.5 | 37,634.3 | 34,836.7 | 32,247.1 | 29,849.9 |
| EBITDA, % | 10.37 | 26.34 | 37.11 | 37.54 | 33.25 | 28.92 | 28.92 | 28.92 | 28.92 | 28.92 |
| Depreciation | 10,688.7 | 11,649.7 | 15,577.6 | 16,168.4 | 16,184.5 | 11,024.6 | 10,205.1 | 9,446.5 | 8,744.3 | 8,094.3 |
| Depreciation, % | 4.55 | 7.02 | 7.11 | 9.87 | 10.66 | 7.84 | 7.84 | 7.84 | 7.84 | 7.84 |
| EBIT | 13,656.7 | 32,048.9 | 65,774.3 | 45,303.0 | 34,307.5 | 29,631.9 | 27,429.2 | 25,390.2 | 23,502.8 | 21,755.7 |
| EBIT, % | 5.82 | 19.32 | 30 | 27.66 | 22.59 | 21.08 | 21.08 | 21.08 | 21.08 | 21.08 |
| Total Cash | 26,951.9 | 50,026.0 | 49,419.9 | 41,157.7 | 42,038.7 | 32,893.2 | 30,448.1 | 28,184.7 | 26,089.5 | 24,150.1 |
| Total Cash, percent | .0 | .0 | .0 | .0 | .0 | .0 | .0 | .0 | .0 | .0 |
| Account Receivables | 11,374.5 | 17,553.8 | 15,515.4 | 16,374.8 | 18,286.5 | 12,523.9 | 11,592.9 | 10,731.2 | 9,933.4 | 9,195.0 |
| Account Receivables, % | 4.85 | 10.58 | 7.08 | 10 | 12.04 | 8.91 | 8.91 | 8.91 | 8.91 | 8.91 |
| Inventories | 8,421.2 | 9,228.8 | 9,733.1 | 8,450.9 | 8,323.1 | 6,812.8 | 6,306.4 | 5,837.6 | 5,403.7 | 5,002.0 |
| Inventories, % | 3.59 | 5.56 | 4.44 | 5.16 | 5.48 | 4.85 | 4.85 | 4.85 | 4.85 | 4.85 |
| Accounts Payable | 26,114.6 | 28,042.7 | 38,078.9 | 34,308.3 | 35,282.7 | 25,186.4 | 23,314.2 | 21,581.1 | 19,976.8 | 18,491.8 |
| Accounts Payable, % | 11.13 | 16.9 | 17.37 | 20.95 | 23.23 | 17.92 | 17.92 | 17.92 | 17.92 | 17.92 |
| Capital Expenditure | -13,112.4 | -11,396.5 | -19,847.2 | -19,857.1 | -18,640.8 | -12,907.7 | -11,948.2 | -11,060.0 | -10,237.8 | -9,476.8 |
| Capital Expenditure, % | -5.59 | -6.87 | -9.05 | -12.13 | -12.27 | -9.18 | -9.18 | -9.18 | -9.18 | -9.18 |
| Tax Rate, % | 45.89 | 45.89 | 45.89 | 45.89 | 45.89 | 45.89 | 45.89 | 45.89 | 45.89 | 45.89 |
| EBITAT | 11,234.8 | 21,913.1 | 41,072.0 | 24,653.0 | 18,563.0 | 19,059.8 | 17,642.9 | 16,331.4 | 15,117.4 | 13,993.6 |
| Depreciation | ||||||||||
| Changes in Account Receivables | ||||||||||
| Changes in Inventories | ||||||||||
| Changes in Accounts Payable | ||||||||||
| Capital Expenditure | ||||||||||
| UFCF | 15,130.1 | 17,107.4 | 48,372.8 | 17,616.5 | 15,297.2 | 14,353.4 | 15,465.0 | 14,315.4 | 13,251.3 | 12,266.2 |
| WACC, % | 5.13 | 4.81 | 4.67 | 4.49 | 4.48 | 4.71 | 4.71 | 4.71 | 4.71 | 4.71 |
| PV UFCF | ||||||||||
| SUM PV UFCF | 61,042.2 | |||||||||
| Long Term Growth Rate, % | 2.00 | |||||||||
| Free cash flow (T + 1) | 12,512 | |||||||||
| Terminal Value | 460,888 | |||||||||
| Present Terminal Value | 366,065 | |||||||||
| Enterprise Value | 427,107 | |||||||||
| Net Debt | 45,107 | |||||||||
| Equity Value | 382,000 | |||||||||
| Diluted Shares Outstanding, MM | 9,968 | |||||||||
| Equity Value Per Share | 38.32 |
What You'll Receive
- Customizable Excel Template: A fully editable Excel DCF Calculator featuring pre-filled financial data for Yankuang Energy Group Company Limited (1171HK).
- Accurate Data: Access to historical figures and projected estimates (highlighted in the yellow cells).
- Forecast Customization: Modify key assumptions such as revenue growth, EBITDA margin, and WACC.
- Instant Calculations: Quickly observe how your inputs affect the valuation of Yankuang Energy Group Company Limited (1171HK).
- Professional Resource: Designed for investors, CFOs, consultants, and financial analysts.
- User-Centric Layout: Organized for clarity and simplicity, with comprehensive step-by-step guidance.
Key Features
- Customizable Forecast Inputs: Adjust essential parameters such as revenue growth, EBITDA margins, and capital investments.
- Instant DCF Valuation: Automatically computes intrinsic value, NPV, and additional metrics in real-time.
- High-Precision Accuracy: Leverages Yankuang Energy Group’s actual financial data for credible valuation results.
- Simplified Scenario Analysis: Effortlessly explore various assumptions and evaluate their impacts.
- Efficiency Booster: Avoid the hassle of creating intricate valuation models from the ground up.
How It Functions
- Download the Template: Gain immediate access to the Excel-based Yankuang Energy DCF Calculator.
- Input Your Assumptions: Modify the yellow-highlighted cells for growth rates, WACC, margins, and other factors.
- Instant Calculations: The model automatically refreshes Yankuang Energy's intrinsic value.
- Test Scenarios: Experiment with various assumptions to assess potential changes in valuation.
- Analyze and Decide: Utilize the findings to inform your investment or financial evaluation.
Why Opt for This Calculator?
- Designed for Industry Experts: A sophisticated tool tailored for analysts, CFOs, and consultants.
- Accurate Market Data: Yankuang Energy’s historical and projected financials are preloaded for precise analysis.
- Flexible Scenario Analysis: Effortlessly simulate various forecasts and assumptions.
- Comprehensive Outputs: Automatically calculates intrinsic value, NPV, and essential metrics.
- User-Friendly Interface: Step-by-step guidance makes the process straightforward.
Who Can Benefit from Yankuang Energy Group Company Limited (1171HK)?
- Investors: Gain confidence in your investment choices with our professional-grade valuation tool designed for precise analysis.
- Financial Analysts: Enhance efficiency with a customizable, pre-built DCF model tailored for your financial assessments.
- Consultants: Seamlessly modify the template for impactful client presentations and detailed reports.
- Finance Enthusiasts: Expand your knowledge of valuation practices through practical, real-world case studies.
- Educators and Students: Leverage this resource as an effective hands-on learning tool in finance courses.
Contents of the Template
- Historical Data: Contains Yankuang Energy Group's past financial statements and foundational forecasts.
- DCF and Levered DCF Models: Comprehensive templates for estimating the intrinsic value of Yankuang Energy Group (1171HK).
- WACC Sheet: Pre-calculated metrics for the Weighted Average Cost of Capital.
- Editable Inputs: Customize essential drivers such as growth rates, EBITDA percentages, and CAPEX expectations.
- Quarterly and Annual Statements: A thorough analysis of Yankuang Energy Group's financial performance.
- Interactive Dashboard: Visualize valuation outcomes and forecasts in an engaging manner.
Disclaimer
All information, articles, and product details provided on this website are for general informational and educational purposes only. We do not claim any ownership over, nor do we intend to infringe upon, any trademarks, copyrights, logos, brand names, or other intellectual property mentioned or depicted on this site. Such intellectual property remains the property of its respective owners, and any references here are made solely for identification or informational purposes, without implying any affiliation, endorsement, or partnership.
We make no representations or warranties, express or implied, regarding the accuracy, completeness, or suitability of any content or products presented. Nothing on this website should be construed as legal, tax, investment, financial, medical, or other professional advice. In addition, no part of this site—including articles or product references—constitutes a solicitation, recommendation, endorsement, advertisement, or offer to buy or sell any securities, franchises, or other financial instruments, particularly in jurisdictions where such activity would be unlawful.
All content is of a general nature and may not address the specific circumstances of any individual or entity. It is not a substitute for professional advice or services. Any actions you take based on the information provided here are strictly at your own risk. You accept full responsibility for any decisions or outcomes arising from your use of this website and agree to release us from any liability in connection with your use of, or reliance upon, the content or products found herein.