
|
Kinetische Entwicklungsgruppe Limited (1277.HK) DCF -Bewertung |
Fully Editable: Tailor To Your Needs In Excel Or Sheets
Professional Design: Trusted, Industry-Standard Templates
Investor-Approved Valuation Models
MAC/PC Compatible, Fully Unlocked
No Expertise Is Needed; Easy To Follow
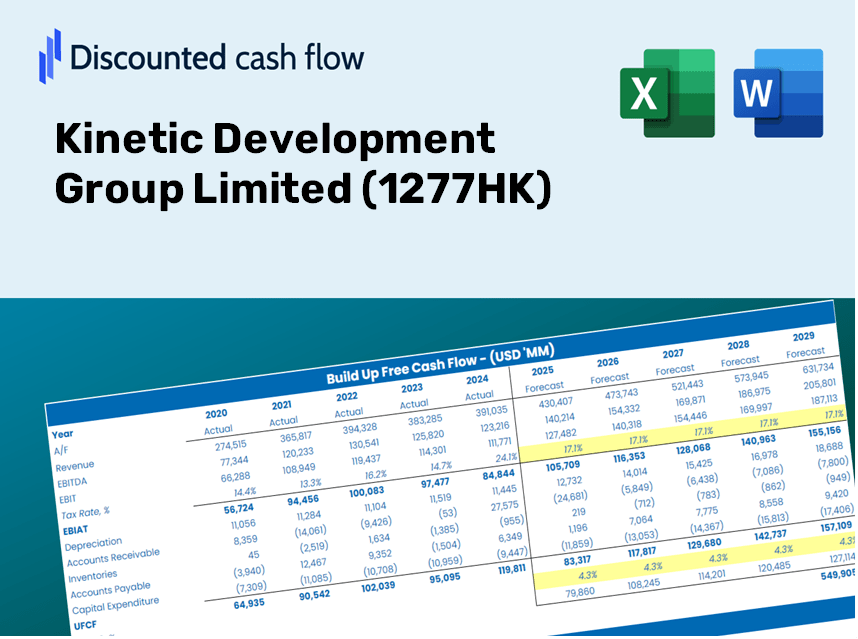
Kinetic Development Group Limited (1277.HK) Bundle
Verbessern Sie Ihre Anlagestrategie mit dem DCF -Taschenrechner (1277HK)! Erforschen Sie authentische Finanzdaten für die kinetische Entwicklungsgruppe Limited, stellen Sie Wachstumsvorhersagen und -kosten an und visualisieren Sie sofort, wie sich diese Modifikationen auf den inneren Wert von (1277HK) auswirken.
Discounted Cash Flow (DCF) - (USD MM)
| Year | AY1 2020 |
AY2 2021 |
AY3 2022 |
AY4 2023 |
AY5 2024 |
FY1 2025 |
FY2 2026 |
FY3 2027 |
FY4 2028 |
FY5 2029 |
|---|---|---|---|---|---|---|---|---|---|---|
| Revenue | 3,235.4 | 6,097.1 | 6,725.5 | 5,184.2 | 6,179.2 | 6,296.3 | 6,415.6 | 6,537.2 | 6,661.1 | 6,787.3 |
| Revenue Growth, % | 0 | 88.45 | 10.31 | -22.92 | 19.19 | 1.9 | 1.9 | 1.9 | 1.9 | 1.9 |
| EBITDA | 1,482.5 | 3,886.5 | 4,173.7 | 2,929.7 | 3,272.2 | 3,539.7 | 3,606.8 | 3,675.1 | 3,744.8 | 3,815.7 |
| EBITDA, % | 45.82 | 63.74 | 62.06 | 56.51 | 52.95 | 56.22 | 56.22 | 56.22 | 56.22 | 56.22 |
| Depreciation | 126.4 | 134.5 | 148.9 | 152.1 | 192.1 | 180.9 | 184.4 | 187.9 | 191.4 | 195.0 |
| Depreciation, % | 3.91 | 2.21 | 2.21 | 2.93 | 3.11 | 2.87 | 2.87 | 2.87 | 2.87 | 2.87 |
| EBIT | 1,356.1 | 3,752.1 | 4,024.8 | 2,777.6 | 3,080.1 | 3,358.7 | 3,422.4 | 3,487.2 | 3,553.3 | 3,620.7 |
| EBIT, % | 41.92 | 61.54 | 59.84 | 53.58 | 49.85 | 53.34 | 53.34 | 53.34 | 53.34 | 53.34 |
| Total Cash | 1,467.9 | 2,902.5 | 811.5 | 1,043.1 | 1,053.6 | 1,790.8 | 1,824.7 | 1,859.3 | 1,894.5 | 1,930.4 |
| Total Cash, percent | .0 | .0 | .0 | .0 | .0 | .0 | .0 | .0 | .0 | .0 |
| Account Receivables | 235.6 | 149.2 | 155.4 | 238.3 | 319.1 | 274.6 | 279.8 | 285.1 | 290.5 | 296.0 |
| Account Receivables, % | 7.28 | 2.45 | 2.31 | 4.6 | 5.16 | 4.36 | 4.36 | 4.36 | 4.36 | 4.36 |
| Inventories | 79.8 | 69.3 | 120.4 | 125.9 | 1,875.2 | 480.6 | 489.8 | 499.0 | 508.5 | 518.1 |
| Inventories, % | 2.47 | 1.14 | 1.79 | 2.43 | 30.35 | 7.63 | 7.63 | 7.63 | 7.63 | 7.63 |
| Accounts Payable | .0 | .0 | .0 | 64.2 | 116.5 | 39.3 | 40.1 | 40.8 | 41.6 | 42.4 |
| Accounts Payable, % | 0 | 0 | 0 | 1.24 | 1.89 | 0.62474 | 0.62474 | 0.62474 | 0.62474 | 0.62474 |
| Capital Expenditure | -93.8 | -4,699.8 | -2,520.1 | -535.3 | -496.2 | -1,710.2 | -1,742.6 | -1,775.6 | -1,809.3 | -1,843.6 |
| Capital Expenditure, % | -2.9 | -77.08 | -37.47 | -10.33 | -8.03 | -27.16 | -27.16 | -27.16 | -27.16 | -27.16 |
| Tax Rate, % | 22.91 | 22.91 | 22.91 | 22.91 | 22.91 | 22.91 | 22.91 | 22.91 | 22.91 | 22.91 |
| EBITAT | 899.7 | 2,706.5 | 2,951.1 | 2,364.5 | 2,374.5 | 2,512.4 | 2,560.1 | 2,608.6 | 2,658.0 | 2,708.4 |
| Depreciation | ||||||||||
| Changes in Account Receivables | ||||||||||
| Changes in Inventories | ||||||||||
| Changes in Accounts Payable | ||||||||||
| Capital Expenditure | ||||||||||
| UFCF | 616.9 | -1,762.0 | 522.5 | 1,957.0 | 292.7 | 2,345.0 | 988.2 | 1,007.0 | 1,026.1 | 1,045.5 |
| WACC, % | 4.79 | 4.82 | 4.83 | 4.91 | 4.86 | 4.84 | 4.84 | 4.84 | 4.84 | 4.84 |
| PV UFCF | ||||||||||
| SUM PV UFCF | 5,684.1 | |||||||||
| Long Term Growth Rate, % | 0.50 | |||||||||
| Free cash flow (T + 1) | 1,051 | |||||||||
| Terminal Value | 24,196 | |||||||||
| Present Terminal Value | 19,101 | |||||||||
| Enterprise Value | 24,785 | |||||||||
| Net Debt | 356 | |||||||||
| Equity Value | 24,429 | |||||||||
| Diluted Shares Outstanding, MM | 8,430 | |||||||||
| Equity Value Per Share | 2.90 |
What You Will Receive
- Authentic Kinetic Data: Preloaded financial metrics – from revenue to EBIT – derived from actual and projected statistics.
- Complete Customization: Modify all key parameters (yellow cells) such as WACC, growth %, and tax rates.
- Real-Time Valuation Updates: Automatic recalculations to assess the impact of changes on Kinetic Development Group's fair value.
- Flexible Excel Template: Designed for easy adjustments, scenario analysis, and comprehensive projections.
- Efficient and Precise: Avoid the hassle of constructing models from scratch while ensuring accuracy and adaptability.
Key Features
- 🔍 Real-Life Kinetic Development Financials: Pre-filled historical and projected data for Kinetic Development Group Limited (1277HK).
- ✏️ Fully Customizable Inputs: Adjust all critical parameters (yellow cells) such as WACC, growth %, and tax rates.
- 📊 Professional DCF Valuation: Built-in formulas calculate the intrinsic value of Kinetic Development using the Discounted Cash Flow method.
- ⚡ Instant Results: Visualize Kinetic Development’s valuation immediately after making changes.
- Scenario Analysis: Test and compare outcomes for different financial assumptions side-by-side.
How It Works
- Step 1: Download the Excel file for Kinetic Development Group Limited (1277HK).
- Step 2: Review the pre-filled financial data and forecasts specific to Kinetic Development Group Limited (1277HK).
- Step 3: Adjust key inputs such as revenue growth, WACC, and tax rates in the highlighted cells.
- Step 4: Observe the DCF model update in real-time as you modify your assumptions.
- Step 5: Analyze the results to inform your investment decisions regarding Kinetic Development Group Limited (1277HK).
Why Opt for the Kinetic Development Group Limited ([1277HK]) Calculator?
- Precision: Leverages authentic Kinetic Development Group Limited financials for reliable data.
- Versatility: Crafted to allow users to effortlessly test and adjust various inputs.
- Efficiency: Avoid the complexities of constructing a DCF model from the ground up.
- Expert-Level: Built with the accuracy and usability expected at the CFO level.
- Intuitive: Designed for ease of use, catering to those without a deep background in financial modeling.
Who Can Benefit from Kinetic Development Group Limited (1277HK)?
- Investors: Empower your investment choices with a professional-grade valuation instrument.
- Financial Analysts: Enhance your efficiency by utilizing a pre-designed DCF model that can be tailored to your needs.
- Consultants: Seamlessly modify the template for impactful client presentations or comprehensive reports.
- Finance Enthusiasts: Expand your knowledge of valuation strategies through practical, real-life examples.
- Educators and Students: Leverage this tool as a hands-on resource in finance coursework.
Overview of the Template Features
- Detailed DCF Model: An editable template featuring extensive valuation computations.
- Real-Time Data: Kinetic Development Group Limited’s historical and projected financials preloaded for in-depth analysis.
- Adjustable Variables: Modify WACC, growth rates, and tax assumptions to explore various scenarios.
- Comprehensive Financial Statements: Complete annual and quarterly reports for enhanced insights.
- Essential Ratios: Integrated analysis for profitability, efficiency, and leverage metrics.
- Interactive Dashboard: Visual representations including charts and tables for clear, actionable insights.
Disclaimer
All information, articles, and product details provided on this website are for general informational and educational purposes only. We do not claim any ownership over, nor do we intend to infringe upon, any trademarks, copyrights, logos, brand names, or other intellectual property mentioned or depicted on this site. Such intellectual property remains the property of its respective owners, and any references here are made solely for identification or informational purposes, without implying any affiliation, endorsement, or partnership.
We make no representations or warranties, express or implied, regarding the accuracy, completeness, or suitability of any content or products presented. Nothing on this website should be construed as legal, tax, investment, financial, medical, or other professional advice. In addition, no part of this site—including articles or product references—constitutes a solicitation, recommendation, endorsement, advertisement, or offer to buy or sell any securities, franchises, or other financial instruments, particularly in jurisdictions where such activity would be unlawful.
All content is of a general nature and may not address the specific circumstances of any individual or entity. It is not a substitute for professional advice or services. Any actions you take based on the information provided here are strictly at your own risk. You accept full responsibility for any decisions or outcomes arising from your use of this website and agree to release us from any liability in connection with your use of, or reliance upon, the content or products found herein.