
|
Shanghai Dazhong Public Utilities Co., Ltd. (1635.HK) DCF -Bewertung |
Fully Editable: Tailor To Your Needs In Excel Or Sheets
Professional Design: Trusted, Industry-Standard Templates
Investor-Approved Valuation Models
MAC/PC Compatible, Fully Unlocked
No Expertise Is Needed; Easy To Follow
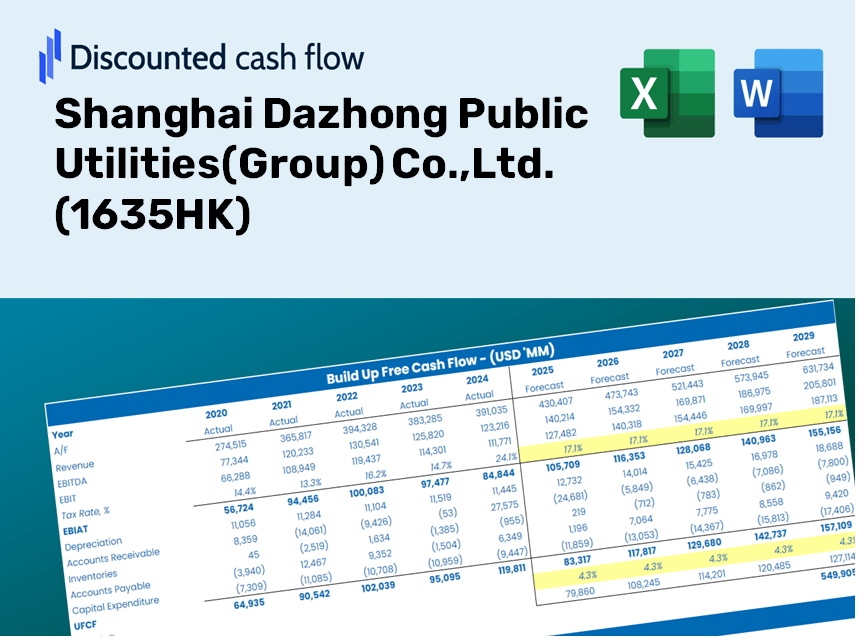
Shanghai Dazhong Public Utilities(Group) Co.,Ltd. (1635.HK) Bundle
Bewerten Sie die finanziellen Aussichten von Shanghai Dazhong Public Utilities (Group) Co., Ltd. (1635HK) Wie ein Experte! Dieser (1635HK) DCF-Taschenrechner liefert vorgefüllte Finanzdaten und ermöglicht es Ihnen, das Umsatzwachstum, WACC, Margen und andere wesentliche Annahmen anzupassen, um sich an Ihren Projektionen anzupassen.
Discounted Cash Flow (DCF) - (USD MM)
| Year | AY1 2020 |
AY2 2021 |
AY3 2022 |
AY4 2023 |
AY5 2024 |
FY1 2025 |
FY2 2026 |
FY3 2027 |
FY4 2028 |
FY5 2029 |
|---|---|---|---|---|---|---|---|---|---|---|
| Revenue | 5,361.0 | 6,044.8 | 6,390.4 | 6,992.3 | 6,916.8 | 7,380.5 | 7,875.2 | 8,403.1 | 8,966.4 | 9,567.4 |
| Revenue Growth, % | 0 | 12.76 | 5.72 | 9.42 | -1.08 | 6.7 | 6.7 | 6.7 | 6.7 | 6.7 |
| EBITDA | 1,603.2 | 1,283.6 | 412.8 | 1,150.3 | 1,171.3 | 1,343.0 | 1,433.0 | 1,529.1 | 1,631.6 | 1,740.9 |
| EBITDA, % | 29.9 | 21.23 | 6.46 | 16.45 | 16.93 | 18.2 | 18.2 | 18.2 | 18.2 | 18.2 |
| Depreciation | 390.5 | 373.7 | 383.3 | 388.8 | 415.1 | 458.0 | 488.7 | 521.4 | 556.4 | 593.7 |
| Depreciation, % | 7.28 | 6.18 | 6 | 5.56 | 6 | 6.21 | 6.21 | 6.21 | 6.21 | 6.21 |
| EBIT | 1,212.7 | 909.8 | 29.5 | 761.5 | 756.3 | 885.0 | 944.4 | 1,007.7 | 1,075.2 | 1,147.3 |
| EBIT, % | 22.62 | 15.05 | 0.46148 | 10.89 | 10.93 | 11.99 | 11.99 | 11.99 | 11.99 | 11.99 |
| Total Cash | 3,028.2 | 2,765.9 | 3,500.7 | 3,638.9 | 3,846.0 | 3,906.8 | 4,168.6 | 4,448.1 | 4,746.2 | 5,064.4 |
| Total Cash, percent | .0 | .0 | .0 | .0 | .0 | .0 | .0 | .0 | .0 | .0 |
| Account Receivables | 642.2 | 1,393.2 | 751.8 | .0 | 688.3 | 837.6 | 893.7 | 953.7 | 1,017.6 | 1,085.8 |
| Account Receivables, % | 11.98 | 23.05 | 11.77 | 0 | 9.95 | 11.35 | 11.35 | 11.35 | 11.35 | 11.35 |
| Inventories | 380.0 | 422.9 | 363.6 | 325.8 | 299.2 | 424.5 | 453.0 | 483.3 | 515.7 | 550.3 |
| Inventories, % | 7.09 | 7 | 5.69 | 4.66 | 4.33 | 5.75 | 5.75 | 5.75 | 5.75 | 5.75 |
| Accounts Payable | 1,724.4 | 1,754.9 | 1,891.4 | 1,760.7 | 2,009.5 | 2,140.7 | 2,284.2 | 2,437.4 | 2,600.7 | 2,775.1 |
| Accounts Payable, % | 32.17 | 29.03 | 29.6 | 25.18 | 29.05 | 29.01 | 29.01 | 29.01 | 29.01 | 29.01 |
| Capital Expenditure | -707.8 | -705.5 | -311.5 | -385.8 | -530.4 | -633.8 | -676.2 | -721.6 | -769.9 | -821.6 |
| Capital Expenditure, % | -13.2 | -11.67 | -4.87 | -5.52 | -7.67 | -8.59 | -8.59 | -8.59 | -8.59 | -8.59 |
| Tax Rate, % | 46.37 | 46.37 | 46.37 | 46.37 | 46.37 | 46.37 | 46.37 | 46.37 | 46.37 | 46.37 |
| EBITAT | 802.6 | 558.8 | 25.0 | 401.8 | 405.6 | 564.4 | 602.2 | 642.5 | 685.6 | 731.6 |
| Depreciation | ||||||||||
| Changes in Account Receivables | ||||||||||
| Changes in Inventories | ||||||||||
| Changes in Accounts Payable | ||||||||||
| Capital Expenditure | ||||||||||
| UFCF | 1,187.5 | -536.4 | 934.0 | 1,063.7 | -122.7 | 245.3 | 473.5 | 505.2 | 539.1 | 575.2 |
| WACC, % | 4.82 | 4.74 | 5.14 | 4.6 | 4.61 | 4.78 | 4.78 | 4.78 | 4.78 | 4.78 |
| PV UFCF | ||||||||||
| SUM PV UFCF | 2,007.0 | |||||||||
| Long Term Growth Rate, % | 2.00 | |||||||||
| Free cash flow (T + 1) | 587 | |||||||||
| Terminal Value | 21,076 | |||||||||
| Present Terminal Value | 16,684 | |||||||||
| Enterprise Value | 18,691 | |||||||||
| Net Debt | 2,745 | |||||||||
| Equity Value | 15,946 | |||||||||
| Diluted Shares Outstanding, MM | 2,952 | |||||||||
| Equity Value Per Share | 5.40 |
What You Will Receive
- Comprehensive Financial Model: Utilize Shanghai Dazhong Public Utilities' actual data for accurate DCF valuation.
- Complete Forecast Flexibility: Modify revenue growth, profit margins, WACC, and other essential factors.
- Real-Time Calculations: Instant updates allow you to see results immediately as adjustments are made.
- Professional-Grade Template: A polished Excel file crafted for high-quality valuation.
- Customizable and Versatile: Designed for adaptability, enabling repetitive use for in-depth forecasts.
Key Features
- Pre-Loaded Data: Historical financial statements and forecasts for Shanghai Dazhong Public Utilities (1635HK).
- Fully Adjustable Inputs: Customize WACC, tax rates, revenue growth, and EBITDA margins as needed.
- Instant Results: View the intrinsic value of Shanghai Dazhong Public Utilities (1635HK) updated in real time.
- Clear Visual Outputs: Interactive dashboard charts showcase valuation results and essential metrics.
- Built for Accuracy: A reliable tool designed for analysts, investors, and financial professionals.
How It Works
- Download: Obtain the pre-formatted Excel file containing Shanghai Dazhong Public Utilities (Group) Co., Ltd.'s financial data.
- Customize: Modify projections, including revenue growth rates, EBITDA margins, and WACC.
- Update Automatically: Watch as the intrinsic value and NPV calculations refresh in real-time.
- Test Scenarios: Develop various forecasts and instantly compare different outcomes.
- Make Decisions: Leverage the valuation insights to inform your investment decisions.
Why Choose Shanghai Dazhong Public Utilities (1635HK) Calculator?
- Save Time: Get started immediately with a pre-built DCF model—no setup required.
- Enhance Accuracy: Dependable financial data and formulas help minimize valuation errors.
- Fully Customizable: Adjust the model to align with your unique assumptions and forecasts.
- Easy to Understand: Intuitive charts and outputs simplify analysis of the results.
- Trusted by Professionals: Created for experts who prioritize accuracy and ease of use.
Who Can Benefit from This Product?
- Institutional Investors: Develop comprehensive and trustworthy valuation models for analyzing investments in Shanghai Dazhong Public Utilities (1635HK).
- Corporate Financial Departments: Evaluate valuation scenarios to inform strategic decisions within the organization.
- Financial Consultants and Advisors: Deliver precise valuation insights for clients interested in Shanghai Dazhong Public Utilities (1635HK).
- Academics and Students: Utilize real-world data to enhance learning and practice in financial modeling.
- Utility Sector Analysts: Gain insights into how utility companies like Shanghai Dazhong Public Utilities (1635HK) are valued in the market.
Contents of the Template
- Preloaded 1635HK Data: Historical and forecasted financial information, including revenue, EBIT, and capital expenditures.
- DCF and WACC Models: Advanced worksheets designed for calculating intrinsic value and Weighted Average Cost of Capital.
- Editable Inputs: Cells highlighted in yellow for modifying revenue growth, tax rates, and discount rates.
- Financial Statements: Detailed annual and quarterly financial reports for in-depth analysis.
- Key Ratios: Metrics for profitability, leverage, and efficiency to assess performance.
- Dashboard and Charts: Visual representations of valuation results and underlying assumptions.
Disclaimer
All information, articles, and product details provided on this website are for general informational and educational purposes only. We do not claim any ownership over, nor do we intend to infringe upon, any trademarks, copyrights, logos, brand names, or other intellectual property mentioned or depicted on this site. Such intellectual property remains the property of its respective owners, and any references here are made solely for identification or informational purposes, without implying any affiliation, endorsement, or partnership.
We make no representations or warranties, express or implied, regarding the accuracy, completeness, or suitability of any content or products presented. Nothing on this website should be construed as legal, tax, investment, financial, medical, or other professional advice. In addition, no part of this site—including articles or product references—constitutes a solicitation, recommendation, endorsement, advertisement, or offer to buy or sell any securities, franchises, or other financial instruments, particularly in jurisdictions where such activity would be unlawful.
All content is of a general nature and may not address the specific circumstances of any individual or entity. It is not a substitute for professional advice or services. Any actions you take based on the information provided here are strictly at your own risk. You accept full responsibility for any decisions or outcomes arising from your use of this website and agree to release us from any liability in connection with your use of, or reliance upon, the content or products found herein.