
|
DL Holdings Group Limited (1709.HK) DCF -Bewertung |
Fully Editable: Tailor To Your Needs In Excel Or Sheets
Professional Design: Trusted, Industry-Standard Templates
Investor-Approved Valuation Models
MAC/PC Compatible, Fully Unlocked
No Expertise Is Needed; Easy To Follow
DL Holdings Group Limited (1709.HK) Bundle
Entdecken Sie die finanziellen Aussichten der DL Holdings Group Limited (1709HK) mit unserem benutzerfreundlichen DCF-Taschenrechner! Geben Sie Ihre Annahmen für Wachstum, Margen und Kosten ein, um den inneren Wert der DL Holdings Group Limited (1709HK) zu bestimmen und Ihre Anlagestrategie zu verfeinern.
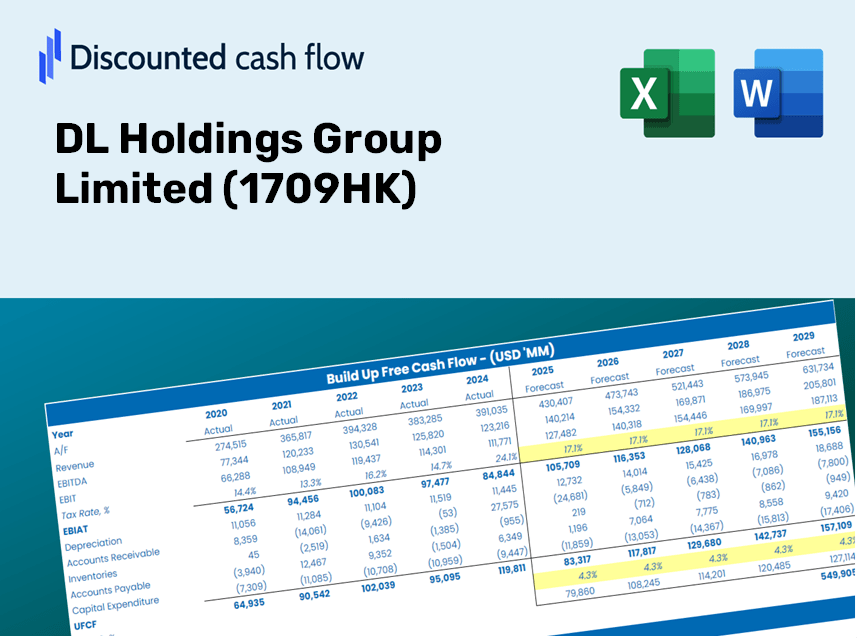
Discounted Cash Flow (DCF) - (USD MM)
| Year | AY1 2020 |
AY2 2021 |
AY3 2022 |
AY4 2023 |
AY5 2024 |
FY1 2025 |
FY2 2026 |
FY3 2027 |
FY4 2028 |
FY5 2029 |
|---|---|---|---|---|---|---|---|---|---|---|
| Revenue | 422.7 | 300.4 | 179.4 | 202.4 | 189.7 | 159.9 | 134.9 | 113.7 | 95.9 | 80.9 |
| Revenue Growth, % | 0 | -28.93 | -40.28 | 12.79 | -6.27 | -15.67 | -15.67 | -15.67 | -15.67 | -15.67 |
| EBITDA | 226.6 | 137.1 | -26.9 | 120.8 | 188.0 | 77.7 | 65.6 | 55.3 | 46.6 | 39.3 |
| EBITDA, % | 53.61 | 45.63 | -15.02 | 59.69 | 99.14 | 48.61 | 48.61 | 48.61 | 48.61 | 48.61 |
| Depreciation | 6.7 | 7.6 | 6.9 | 8.5 | 20.7 | 7.4 | 6.2 | 5.3 | 4.4 | 3.7 |
| Depreciation, % | 1.59 | 2.54 | 3.85 | 4.18 | 10.93 | 4.62 | 4.62 | 4.62 | 4.62 | 4.62 |
| EBIT | 219.9 | 129.4 | -33.8 | 112.3 | 167.3 | 70.4 | 59.3 | 50.0 | 42.2 | 35.6 |
| EBIT, % | 52.01 | 43.09 | -18.86 | 55.52 | 88.21 | 43.99 | 43.99 | 43.99 | 43.99 | 43.99 |
| Total Cash | 56.2 | 154.6 | 83.5 | 39.8 | 31.7 | 47.3 | 39.8 | 33.6 | 28.3 | 23.9 |
| Total Cash, percent | .0 | .0 | .0 | .0 | .0 | .0 | .0 | .0 | .0 | .0 |
| Account Receivables | 300.4 | 378.5 | 318.9 | 397.8 | 525.3 | 150.7 | 127.1 | 107.1 | 90.4 | 76.2 |
| Account Receivables, % | 71.06 | 125.98 | 177.76 | 196.59 | 276.96 | 94.21 | 94.21 | 94.21 | 94.21 | 94.21 |
| Inventories | -347.2 | -525.1 | -330.2 | .7 | .0 | -90.1 | -76.0 | -64.1 | -54.0 | -45.6 |
| Inventories, % | -82.13 | -174.79 | -184.07 | 0.33012 | 0 | -56.36 | -56.36 | -56.36 | -56.36 | -56.36 |
| Accounts Payable | 44.6 | 132.7 | 249.2 | 209.0 | 88.4 | 96.4 | 81.3 | 68.5 | 57.8 | 48.7 |
| Accounts Payable, % | 10.56 | 44.18 | 138.9 | 103.27 | 46.59 | 60.27 | 60.27 | 60.27 | 60.27 | 60.27 |
| Capital Expenditure | -.8 | -2.2 | -.4 | -1.3 | -7.3 | -1.8 | -1.5 | -1.3 | -1.1 | -.9 |
| Capital Expenditure, % | -0.19257 | -0.72699 | -0.2341 | -0.6459 | -3.85 | -1.13 | -1.13 | -1.13 | -1.13 | -1.13 |
| Tax Rate, % | 0.35833 | 0.35833 | 0.35833 | 0.35833 | 0.35833 | 0.35833 | 0.35833 | 0.35833 | 0.35833 | 0.35833 |
| EBITAT | 202.7 | 117.9 | -38.0 | 107.1 | 166.7 | 67.3 | 56.7 | 47.9 | 40.4 | 34.0 |
| Depreciation | ||||||||||
| Changes in Account Receivables | ||||||||||
| Changes in Inventories | ||||||||||
| Changes in Accounts Payable | ||||||||||
| Capital Expenditure | ||||||||||
| UFCF | 300.0 | 311.3 | -50.4 | -335.8 | -67.3 | 545.6 | 55.8 | 47.1 | 39.7 | 33.5 |
| WACC, % | 5.47 | 5.46 | 5.53 | 5.49 | 5.52 | 5.49 | 5.49 | 5.49 | 5.49 | 5.49 |
| PV UFCF | ||||||||||
| SUM PV UFCF | 665.2 | |||||||||
| Long Term Growth Rate, % | 2.00 | |||||||||
| Free cash flow (T + 1) | 34 | |||||||||
| Terminal Value | 977 | |||||||||
| Present Terminal Value | 748 | |||||||||
| Enterprise Value | 1,413 | |||||||||
| Net Debt | 178 | |||||||||
| Equity Value | 1,235 | |||||||||
| Diluted Shares Outstanding, MM | 1,484 | |||||||||
| Equity Value Per Share | 0.83 |
What You Will Receive
- Authentic DL Holdings Financial Data: Pre-loaded with historical and projected data for detailed analysis.
- Completely Customizable Template: Easily adjust essential inputs such as revenue growth, WACC, and EBITDA percentage.
- Instant Calculations: Watch the intrinsic value of DL Holdings refresh in real-time as you modify inputs.
- Expert Valuation Tool: Tailored for investors, analysts, and consultants aiming for reliable DCF results.
- Intuitive Interface: Designed with a straightforward layout and easy-to-follow guidelines suitable for all skill levels.
Key Features
- Accurate Financial Data for DL Holdings Group Limited (1709HK): Access reliable pre-loaded historical figures and future projections.
- Tailored Forecast Assumptions: Modify yellow-highlighted cells such as WACC, growth rates, and profit margins as needed.
- Real-Time Calculations: Automatic updates for DCF, Net Present Value (NPV), and cash flow analyses.
- User-Friendly Visual Dashboard: Intuitive charts and summaries for easy interpretation of your valuation outcomes.
- Designed for All Users: A straightforward, intuitive layout created for investors, CFOs, and consultants alike.
How It Works
- Step 1: Download the Excel file.
- Step 2: Review DL Holdings Group Limited’s pre-filled financial data and forecasts.
- Step 3: Adjust key inputs such as revenue growth, WACC, and tax rates (highlighted cells).
- Step 4: Observe the DCF model update in real-time as you modify the assumptions.
- Step 5: Evaluate the outputs and leverage the results for investment decisions.
Why Choose This Calculator for DL Holdings Group Limited (1709HK)?
- User-Friendly Interface: Crafted for both novices and seasoned professionals.
- Customizable Parameters: Easily adjust inputs to tailor your analysis.
- Real-Time Updates: Observe immediate changes in DL Holdings’ valuation as you modify inputs.
- Preloaded Financials: Comes equipped with DL Holdings’ latest financial data for swift analysis.
- Professional Endorsement: Trusted by investors and analysts for making strategic decisions.
Who Can Benefit from This Product?
- Professional Investors: Develop comprehensive and accurate valuation models for portfolio assessments related to DL Holdings Group Limited (1709HK).
- Corporate Finance Teams: Evaluate valuation scenarios to inform and support internal strategic decisions for DL Holdings Group Limited (1709HK).
- Consultants and Advisors: Deliver precise valuation insights for clients interested in DL Holdings Group Limited (1709HK).
- Students and Educators: Utilize real-world data to enhance learning and practice in financial modeling with DL Holdings Group Limited (1709HK).
- Market Analysts: Gain insights into how companies like DL Holdings Group Limited (1709HK) are valued in the financial markets.
Contents of the Template
- Pre-Filled Data: Contains DL Holdings Group Limited's historical financials and outlook.
- Discounted Cash Flow Model: An editable DCF valuation model with automated calculations.
- Weighted Average Cost of Capital (WACC): A dedicated worksheet for WACC calculation using customized inputs.
- Key Financial Ratios: Evaluate DL Holdings Group Limited's profitability, efficiency, and leverage metrics.
- Customizable Inputs: Easily modify revenue growth rates, profit margins, and tax rates.
- Clear Dashboard: Visual representations in charts and tables displaying essential valuation results.
Disclaimer
All information, articles, and product details provided on this website are for general informational and educational purposes only. We do not claim any ownership over, nor do we intend to infringe upon, any trademarks, copyrights, logos, brand names, or other intellectual property mentioned or depicted on this site. Such intellectual property remains the property of its respective owners, and any references here are made solely for identification or informational purposes, without implying any affiliation, endorsement, or partnership.
We make no representations or warranties, express or implied, regarding the accuracy, completeness, or suitability of any content or products presented. Nothing on this website should be construed as legal, tax, investment, financial, medical, or other professional advice. In addition, no part of this site—including articles or product references—constitutes a solicitation, recommendation, endorsement, advertisement, or offer to buy or sell any securities, franchises, or other financial instruments, particularly in jurisdictions where such activity would be unlawful.
All content is of a general nature and may not address the specific circumstances of any individual or entity. It is not a substitute for professional advice or services. Any actions you take based on the information provided here are strictly at your own risk. You accept full responsibility for any decisions or outcomes arising from your use of this website and agree to release us from any liability in connection with your use of, or reliance upon, the content or products found herein.