
|
GF Securities Co., Ltd. (1776.HK) DCF -Bewertung |
Fully Editable: Tailor To Your Needs In Excel Or Sheets
Professional Design: Trusted, Industry-Standard Templates
Investor-Approved Valuation Models
MAC/PC Compatible, Fully Unlocked
No Expertise Is Needed; Easy To Follow
GF Securities Co., Ltd. (1776.HK) Bundle
Optimieren Sie Ihre Zeit und verbessern Sie die Präzision mit unserem DCF -Taschenrechner (1776HK)! Mit tatsächlichen Daten von GF Securities Co., Ltd. und anpassbaren Annahmen ermöglicht dieses Tool, GF -Wertpapiere wie einen erfahrenen Anleger prognostizieren, analysieren und bewerten.
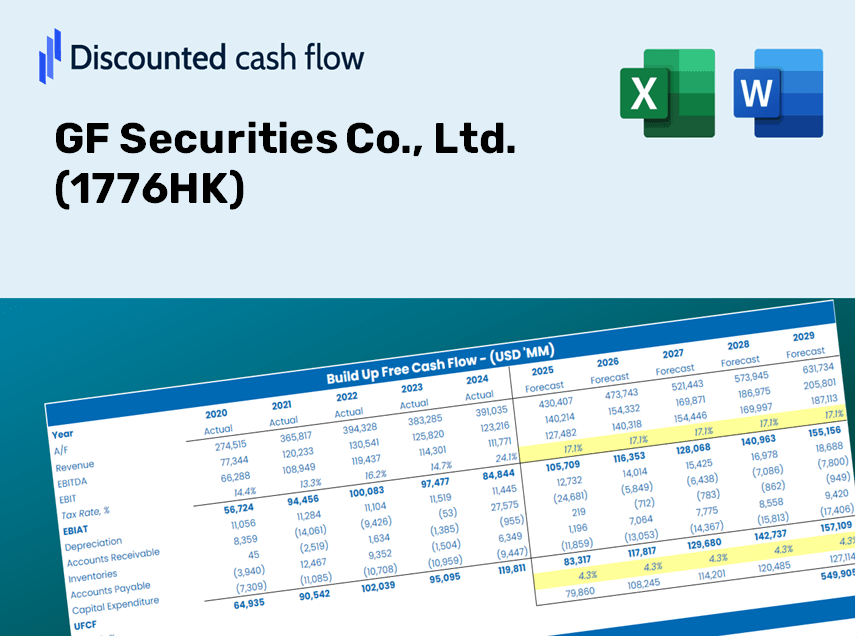
Discounted Cash Flow (DCF) - (USD MM)
| Year | AY1 2020 |
AY2 2021 |
AY3 2022 |
AY4 2023 |
AY5 2024 |
FY1 2025 |
FY2 2026 |
FY3 2027 |
FY4 2028 |
FY5 2029 |
|---|---|---|---|---|---|---|---|---|---|---|
| Revenue | 30,714.7 | 45,353.4 | 35,999.6 | 24,664.5 | 28,849.3 | 29,752.1 | 30,683.1 | 31,643.2 | 32,633.3 | 33,654.5 |
| Revenue Growth, % | 0 | 47.66 | -20.62 | -31.49 | 16.97 | 3.13 | 3.13 | 3.13 | 3.13 | 3.13 |
| EBITDA | .0 | .0 | .0 | .0 | .0 | .0 | .0 | .0 | .0 | .0 |
| EBITDA, % | 0 | 0 | 0 | 0 | 0 | 0 | 0 | 0 | 0 | 0 |
| Depreciation | 810.6 | 777.4 | 847.6 | 963.3 | 1,060.0 | 850.2 | 876.8 | 904.2 | 932.5 | 961.7 |
| Depreciation, % | 2.64 | 1.71 | 2.35 | 3.91 | 3.67 | 2.86 | 2.86 | 2.86 | 2.86 | 2.86 |
| EBIT | -810.6 | -777.4 | -847.6 | -963.3 | -1,060.0 | -850.2 | -876.8 | -904.2 | -932.5 | -961.7 |
| EBIT, % | -2.64 | -1.71 | -2.35 | -3.91 | -3.67 | -2.86 | -2.86 | -2.86 | -2.86 | -2.86 |
| Total Cash | 240,882.7 | 280,490.6 | 284,083.9 | 290,272.4 | 367,317.6 | 29,752.1 | 30,683.1 | 31,643.2 | 32,633.3 | 33,654.5 |
| Total Cash, percent | .0 | .0 | .0 | .0 | .0 | .0 | .0 | .0 | .0 | .0 |
| Account Receivables | 3,719.2 | 5,345.5 | 15,046.2 | 12,180.6 | 9,460.3 | 8,798.7 | 9,074.1 | 9,358.0 | 9,650.8 | 9,952.8 |
| Account Receivables, % | 12.11 | 11.79 | 41.8 | 49.39 | 32.79 | 29.57 | 29.57 | 29.57 | 29.57 | 29.57 |
| Inventories | .0 | .0 | .0 | .0 | .0 | .0 | .0 | .0 | .0 | .0 |
| Inventories, % | 0 | 0 | 0 | 0 | 0 | 0 | 0 | 0 | 0 | 0 |
| Accounts Payable | 2,846.3 | 7,728.7 | 23,826.8 | 40,575.0 | 34,456.9 | 17,404.6 | 17,949.2 | 18,510.9 | 19,090.1 | 19,687.5 |
| Accounts Payable, % | 9.27 | 17.04 | 66.19 | 164.51 | 119.44 | 58.5 | 58.5 | 58.5 | 58.5 | 58.5 |
| Capital Expenditure | -3,329.1 | -733.0 | -784.2 | -1,028.6 | -803.9 | -1,284.7 | -1,324.9 | -1,366.4 | -1,409.1 | -1,453.2 |
| Capital Expenditure, % | -10.84 | -1.62 | -2.18 | -4.17 | -2.79 | -4.32 | -4.32 | -4.32 | -4.32 | -4.32 |
| Tax Rate, % | 18.69 | 18.69 | 18.69 | 18.69 | 18.69 | 18.69 | 18.69 | 18.69 | 18.69 | 18.69 |
| EBITAT | -598.3 | -563.9 | -647.0 | -768.7 | -861.9 | -652.6 | -673.0 | -694.1 | -715.8 | -738.2 |
| Depreciation | ||||||||||
| Changes in Account Receivables | ||||||||||
| Changes in Inventories | ||||||||||
| Changes in Accounts Payable | ||||||||||
| Capital Expenditure | ||||||||||
| UFCF | -3,989.7 | 2,736.5 | 5,813.9 | 18,779.8 | -4,003.6 | -17,477.8 | -851.8 | -878.5 | -906.0 | -934.3 |
| WACC, % | 10.03 | 9.97 | 10.16 | 10.34 | 10.41 | 10.18 | 10.18 | 10.18 | 10.18 | 10.18 |
| PV UFCF | ||||||||||
| SUM PV UFCF | -18,411.0 | |||||||||
| Long Term Growth Rate, % | 2.00 | |||||||||
| Free cash flow (T + 1) | -953 | |||||||||
| Terminal Value | -11,646 | |||||||||
| Present Terminal Value | -7,172 | |||||||||
| Enterprise Value | -25,583 | |||||||||
| Net Debt | 44,330 | |||||||||
| Equity Value | -69,912 | |||||||||
| Diluted Shares Outstanding, MM | 7,606 | |||||||||
| Equity Value Per Share | -9.19 |
What You Will Receive
- Authentic GF Securities Financial Data: Access both historical and projected figures for precise valuation.
- Customizable Variables: Adjust WACC, tax rates, revenue growth, and capital expenditures to fit your analysis.
- Real-Time Calculations: Intrinsic value and NPV are computed automatically as you update inputs.
- Comprehensive Scenario Analysis: Explore various scenarios to assess the future performance of GF Securities.
- User-Friendly Interface: Designed for professionals while remaining approachable for newcomers.
Key Features
- 🔍 Real-Life GF Securities Financials: Pre-filled historical and projected data for GF Securities Co., Ltd. (1776HK).
- ✏️ Fully Customizable Inputs: Modify all essential parameters (yellow cells) such as WACC, growth %, and tax rates.
- 📊 Professional DCF Valuation: Integrated formulas determine GF Securities' intrinsic value using the Discounted Cash Flow approach.
- ⚡ Instant Results: Visualize GF Securities' valuation immediately after making adjustments.
- Scenario Analysis: Evaluate and contrast outcomes for different financial assumptions side-by-side.
How It Operates
- Download: Obtain the pre-configured Excel file containing financial data for GF Securities Co., Ltd. (1776HK).
- Customize: Modify forecasts, such as revenue growth, EBITDA %, and WACC to suit your analysis.
- Update Automatically: Enjoy real-time updates for intrinsic value and NPV calculations.
- Test Scenarios: Generate various projections and quickly evaluate different outcomes.
- Make Decisions: Leverage the valuation insights to inform your investment approach.
Why Opt for GF Securities Co., Ltd. Calculator?
- Designed for Industry Experts: A sophisticated tool favored by analysts, investment managers, and financial advisors.
- Up-to-Date Market Data: Comprehensive access to GF Securities Co., Ltd. (1776HK) historical and forecasted financials for precise insights.
- Flexible Scenario Analysis: Effortlessly test various market scenarios and assumptions.
- Insightful Outputs: Automatically computes intrinsic value, NPV, and other essential financial metrics.
- User-Friendly Interface: Intuitive step-by-step guidance ensures a smooth experience.
Who Should Use GF Securities Co., Ltd. (1776HK)?
- Individual Investors: Gain insights to make informed choices about investing in GF Securities Co., Ltd. (1776HK).
- Financial Analysts: Enhance your valuation processes with efficient and accessible financial models tailored for GF Securities Co., Ltd. (1776HK).
- Consultants: Provide timely and precise valuation evaluations for clients involving GF Securities Co., Ltd. (1776HK).
- Business Owners: Learn how major firms like GF Securities Co., Ltd. (1776HK) are valued to inform your own business strategies.
- Finance Students: Explore valuation methodologies through practical applications and data from GF Securities Co., Ltd. (1776HK).
Contents of the Template
- Operating and Balance Sheet Data: Pre-filled historical data and projections for GF Securities Co., Ltd. (1776HK), including metrics such as revenue, EBITDA, EBIT, and capital expenditures.
- WACC Calculation: A dedicated sheet for calculating the Weighted Average Cost of Capital (WACC), featuring inputs like Beta, risk-free rate, and share price.
- DCF Valuation (Unlevered and Levered): Customizable Discounted Cash Flow models that provide intrinsic value along with comprehensive calculations.
- Financial Statements: Pre-loaded annual and quarterly financial statements to facilitate thorough analysis.
- Key Ratios: A collection of profitability, leverage, and efficiency ratios pertinent to GF Securities Co., Ltd. (1776HK).
- Dashboard and Charts: A visual overview of valuation outcomes and underlying assumptions for straightforward result analysis.
Disclaimer
All information, articles, and product details provided on this website are for general informational and educational purposes only. We do not claim any ownership over, nor do we intend to infringe upon, any trademarks, copyrights, logos, brand names, or other intellectual property mentioned or depicted on this site. Such intellectual property remains the property of its respective owners, and any references here are made solely for identification or informational purposes, without implying any affiliation, endorsement, or partnership.
We make no representations or warranties, express or implied, regarding the accuracy, completeness, or suitability of any content or products presented. Nothing on this website should be construed as legal, tax, investment, financial, medical, or other professional advice. In addition, no part of this site—including articles or product references—constitutes a solicitation, recommendation, endorsement, advertisement, or offer to buy or sell any securities, franchises, or other financial instruments, particularly in jurisdictions where such activity would be unlawful.
All content is of a general nature and may not address the specific circumstances of any individual or entity. It is not a substitute for professional advice or services. Any actions you take based on the information provided here are strictly at your own risk. You accept full responsibility for any decisions or outcomes arising from your use of this website and agree to release us from any liability in connection with your use of, or reliance upon, the content or products found herein.