
|
ESR Group Limited (1821.HK) DCF -Bewertung |
Fully Editable: Tailor To Your Needs In Excel Or Sheets
Professional Design: Trusted, Industry-Standard Templates
Investor-Approved Valuation Models
MAC/PC Compatible, Fully Unlocked
No Expertise Is Needed; Easy To Follow
ESR Group Limited (1821.HK) Bundle
Vereinfachen Sie die Bewertung der ESR Group Limited (1821HK) mit diesem anpassbaren DCF -Taschenrechner! Mit Real ESR Group Limited (1821HK) Finanzdaten und einstellbaren Prognoseeingaben können Sie Szenarien testen und die ESR Group Limited (1821HK) in Minuten aufdecken.
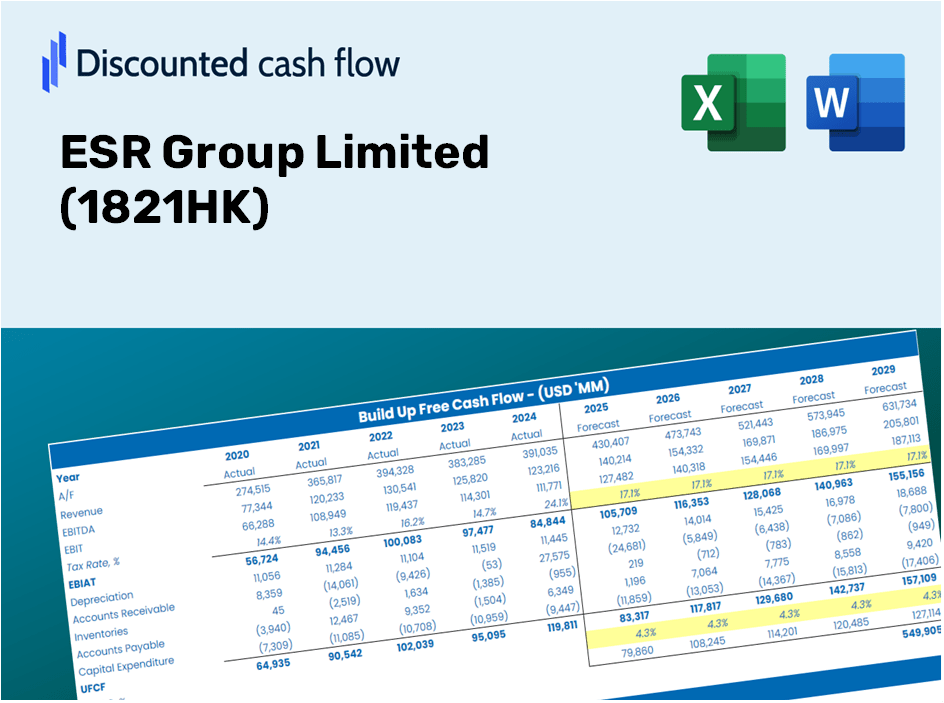
Discounted Cash Flow (DCF) - (USD MM)
| Year | AY1 2020 |
AY2 2021 |
AY3 2022 |
AY4 2023 |
AY5 2024 |
FY1 2025 |
FY2 2026 |
FY3 2027 |
FY4 2028 |
FY5 2029 |
|---|---|---|---|---|---|---|---|---|---|---|
| Revenue | 3,867.8 | 4,487.6 | 8,214.1 | 6,830.2 | 4,714.3 | 5,007.0 | 5,317.9 | 5,648.1 | 5,998.8 | 6,371.3 |
| Revenue Growth, % | 0 | 16.02 | 83.04 | -16.85 | -30.98 | 6.21 | 6.21 | 6.21 | 6.21 | 6.21 |
| EBITDA | 1,521.7 | 1,402.5 | 1,633.1 | 5,937.8 | .0 | 1,776.6 | 1,886.9 | 2,004.1 | 2,128.5 | 2,260.7 |
| EBITDA, % | 39.34 | 31.25 | 19.88 | 86.93 | 0 | 35.48 | 35.48 | 35.48 | 35.48 | 35.48 |
| Depreciation | 134.4 | 134.3 | 375.2 | 394.6 | .0 | 168.4 | 178.8 | 189.9 | 201.7 | 214.2 |
| Depreciation, % | 3.47 | 2.99 | 4.57 | 5.78 | 0 | 3.36 | 3.36 | 3.36 | 3.36 | 3.36 |
| EBIT | 1,387.4 | 1,268.2 | 1,257.9 | 5,543.1 | .0 | 1,608.2 | 1,708.1 | 1,814.2 | 1,926.8 | 2,046.4 |
| EBIT, % | 35.87 | 28.26 | 15.31 | 81.16 | 0 | 32.12 | 32.12 | 32.12 | 32.12 | 32.12 |
| Total Cash | 11,879.2 | 12,841.8 | 14,164.1 | 7,505.6 | 6,639.2 | 5,007.0 | 5,317.9 | 5,648.1 | 5,998.8 | 6,371.3 |
| Total Cash, percent | .0 | .0 | .0 | .0 | .0 | .0 | .0 | .0 | .0 | .0 |
| Account Receivables | .0 | .0 | .0 | .0 | .0 | .0 | .0 | .0 | .0 | .0 |
| Account Receivables, % | 0 | 0 | 0 | 0 | 0 | 0 | 0 | 0 | 0 | 0 |
| Inventories | .0 | .0 | .0 | .0 | .0 | .0 | .0 | .0 | .0 | .0 |
| Inventories, % | 0 | 0 | 0 | 0 | 0 | 0 | 0 | 0 | 0 | 0 |
| Accounts Payable | 45.3 | 23.2 | 131.1 | 107.2 | .0 | 48.6 | 51.6 | 54.8 | 58.3 | 61.9 |
| Accounts Payable, % | 1.17 | 0.51757 | 1.6 | 1.57 | 0 | 0.97107 | 0.97107 | 0.97107 | 0.97107 | 0.97107 |
| Capital Expenditure | -20.1 | -107.3 | -1,230.6 | -696.3 | .0 | -281.3 | -298.7 | -317.3 | -337.0 | -357.9 |
| Capital Expenditure, % | -0.52045 | -2.39 | -14.98 | -10.19 | 0 | -5.62 | -5.62 | -5.62 | -5.62 | -5.62 |
| Tax Rate, % | 6.32 | 6.32 | 6.32 | 6.32 | 6.32 | 6.32 | 6.32 | 6.32 | 6.32 | 6.32 |
| EBITAT | 967.7 | 906.5 | 886.0 | 3,245.8 | .0 | 1,170.5 | 1,243.2 | 1,320.4 | 1,402.4 | 1,489.4 |
| Depreciation | ||||||||||
| Changes in Account Receivables | ||||||||||
| Changes in Inventories | ||||||||||
| Changes in Accounts Payable | ||||||||||
| Capital Expenditure | ||||||||||
| UFCF | 1,127.3 | 911.5 | 138.4 | 2,920.3 | -107.2 | 1,106.2 | 1,126.3 | 1,196.2 | 1,270.5 | 1,349.4 |
| WACC, % | 5.24 | 5.27 | 5.25 | 5.03 | 5.69 | 5.3 | 5.3 | 5.3 | 5.3 | 5.3 |
| PV UFCF | ||||||||||
| SUM PV UFCF | 5,166.7 | |||||||||
| Long Term Growth Rate, % | 4.00 | |||||||||
| Free cash flow (T + 1) | 1,403 | |||||||||
| Terminal Value | 108,081 | |||||||||
| Present Terminal Value | 83,491 | |||||||||
| Enterprise Value | 88,658 | |||||||||
| Net Debt | 42,363 | |||||||||
| Equity Value | 46,295 | |||||||||
| Diluted Shares Outstanding, MM | 4,232 | |||||||||
| Equity Value Per Share | 10.94 |
What You Will Receive
- Genuine ESR Group Financial Data: Pre-loaded with historical and forecasted data for in-depth analysis.
- Fully Customizable Template: Easily adjust crucial inputs like revenue growth, WACC, and EBITDA percentage.
- Instantaneous Calculations: Observe real-time updates of ESR Group's intrinsic value as you make adjustments.
- Professional Valuation Tool: Tailored for investors, analysts, and consultants aiming for precise DCF outcomes.
- User-Friendly Interface: Intuitive layout and straightforward instructions for users of all skill levels.
Key Features
- Comprehensive DCF Calculator: Offers detailed unlevered and levered DCF valuation models tailored for ESR Group Limited (1821HK).
- WACC Calculator: Features a pre-designed Weighted Average Cost of Capital sheet with adjustable inputs specific to the company.
- Customizable Forecast Assumptions: Allows users to tweak growth rates, capital expenditures, and discount rates according to their analysis needs.
- Integrated Financial Ratios: Examine profitability, leverage, and efficiency ratios pertinent to ESR Group Limited (1821HK).
- Interactive Dashboard and Charts: Presents visual summaries of essential valuation metrics for straightforward analysis.
How It Works
- Step 1: Download the prebuilt Excel template containing data for ESR Group Limited (1821HK).
- Step 2: Review the pre-filled sheets to familiarize yourself with the essential metrics.
- Step 3: Update the forecasts and assumptions in the editable yellow cells (WACC, growth, margins).
- Step 4: Instantly see the recalculated results, including the intrinsic value of ESR Group Limited (1821HK).
- Step 5: Utilize the outputs to make informed investment decisions or to create detailed reports.
Why Choose This Calculator for ESR Group Limited (1821HK)?
- User-Friendly Interface: Tailored for both newcomers and seasoned professionals.
- Customizable Inputs: Effortlessly adjust parameters to suit your analysis needs.
- Real-Time Valuation: Observe immediate updates to ESR Group’s valuation as you tweak the inputs.
- Pre-Filled Data: Comes loaded with ESR Group’s current financial information for rapid assessments.
- Relied Upon by Experts: Favored by investors and analysts for making well-informed choices.
Who Can Benefit from This Product?
- Professional Investors: Develop comprehensive and trustworthy valuation models for portfolio assessments related to ESR Group Limited (1821HK).
- Corporate Finance Teams: Evaluate valuation scenarios to inform and refine internal strategies for ESR Group Limited (1821HK).
- Consultants and Advisors: Deliver precise valuation insights to clients focusing on ESR Group Limited (1821HK).
- Students and Educators: Utilize real-world data to enhance learning and practice in financial modeling with a focus on ESR Group Limited (1821HK).
- Tech Enthusiasts: Gain insights into how companies like ESR Group Limited (1821HK) are valued within the market.
Contents of the ESR Group Limited Template
- Preloaded ESR Data: Historical and projected financial information, including revenue, EBIT, and capital expenditures.
- DCF and WACC Models: Professional-grade spreadsheets designed for calculating intrinsic value and Weighted Average Cost of Capital.
- Editable Inputs: Yellow-highlighted fields for customizing revenue growth, tax rates, and discount rates.
- Financial Statements: Detailed annual and quarterly financials for in-depth analysis.
- Key Ratios: Metrics for profitability, leverage, and efficiency to assess performance.
- Dashboard and Charts: Visual representations of valuation results and underlying assumptions.
Disclaimer
All information, articles, and product details provided on this website are for general informational and educational purposes only. We do not claim any ownership over, nor do we intend to infringe upon, any trademarks, copyrights, logos, brand names, or other intellectual property mentioned or depicted on this site. Such intellectual property remains the property of its respective owners, and any references here are made solely for identification or informational purposes, without implying any affiliation, endorsement, or partnership.
We make no representations or warranties, express or implied, regarding the accuracy, completeness, or suitability of any content or products presented. Nothing on this website should be construed as legal, tax, investment, financial, medical, or other professional advice. In addition, no part of this site—including articles or product references—constitutes a solicitation, recommendation, endorsement, advertisement, or offer to buy or sell any securities, franchises, or other financial instruments, particularly in jurisdictions where such activity would be unlawful.
All content is of a general nature and may not address the specific circumstances of any individual or entity. It is not a substitute for professional advice or services. Any actions you take based on the information provided here are strictly at your own risk. You accept full responsibility for any decisions or outcomes arising from your use of this website and agree to release us from any liability in connection with your use of, or reliance upon, the content or products found herein.