
|
Cosco Shipping Holdings Co., Ltd. (1919.HK) DCF -Bewertung |
Fully Editable: Tailor To Your Needs In Excel Or Sheets
Professional Design: Trusted, Industry-Standard Templates
Investor-Approved Valuation Models
MAC/PC Compatible, Fully Unlocked
No Expertise Is Needed; Easy To Follow
COSCO SHIPPING Holdings Co., Ltd. (1919.HK) Bundle
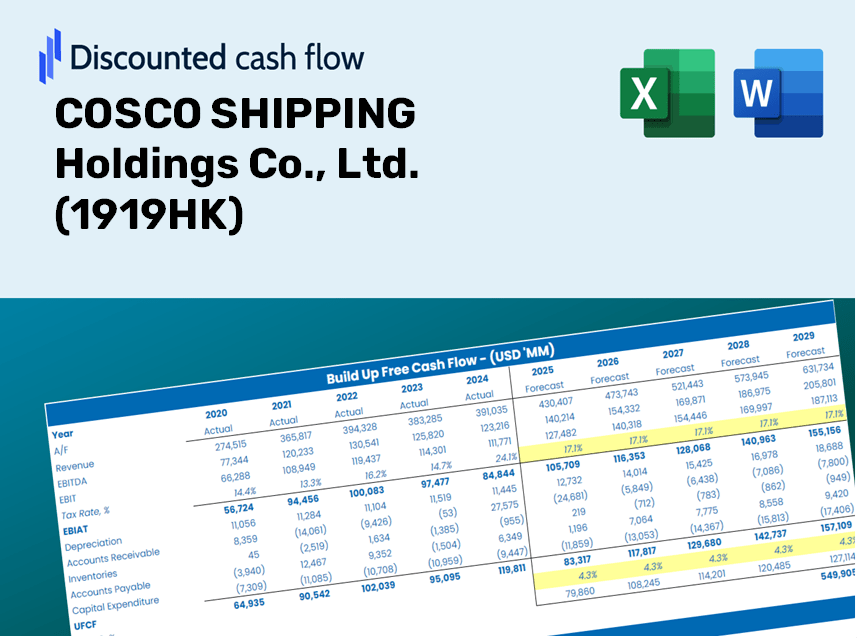
Entdecken Sie den wahren Wert von Cosco Shipping Holdings Co., Ltd. (1919HK) mit unserem fortschrittlichen DCF -Taschenrechner! Passen Sie wesentliche Annahmen an, erkunden Sie verschiedene Szenarien und bewerten Sie die Auswirkungen von Änderungen auf die Bewertung von Cosco Shipping Holdings Co., Ltd. (1919HK) - alles innerhalb einer einzigen Excel -Vorlage.
Discounted Cash Flow (DCF) - (USD MM)
| Year | AY1 2020 |
AY2 2021 |
AY3 2022 |
AY4 2023 |
AY5 2024 |
FY1 2025 |
FY2 2026 |
FY3 2027 |
FY4 2028 |
FY5 2029 |
|---|---|---|---|---|---|---|---|---|---|---|
| Revenue | 187,680.9 | 365,691.6 | 428,557.3 | 192,271.5 | 256,283.9 | 314,073.4 | 384,893.8 | 471,683.4 | 578,043.3 | 708,386.2 |
| Revenue Growth, % | 0 | 94.85 | 17.19 | -55.14 | 33.29 | 22.55 | 22.55 | 22.55 | 22.55 | 22.55 |
| EBITDA | 33,309.9 | 158,554.8 | 209,573.1 | 61,535.0 | 72,511.0 | 106,976.6 | 131,098.8 | 160,660.2 | 196,887.5 | 241,283.6 |
| EBITDA, % | 17.75 | 43.36 | 48.9 | 32 | 28.29 | 34.06 | 34.06 | 34.06 | 34.06 | 34.06 |
| Depreciation | 13,549.3 | 14,225.5 | 22,332.8 | 21,349.4 | 8,680.4 | 19,354.0 | 23,718.1 | 29,066.3 | 35,620.5 | 43,652.6 |
| Depreciation, % | 7.22 | 3.89 | 5.21 | 11.1 | 3.39 | 6.16 | 6.16 | 6.16 | 6.16 | 6.16 |
| EBIT | 19,760.7 | 144,329.3 | 187,240.3 | 40,185.7 | 63,830.6 | 87,622.6 | 107,380.6 | 131,593.9 | 161,267.0 | 197,631.1 |
| EBIT, % | 10.53 | 39.47 | 43.69 | 20.9 | 24.91 | 27.9 | 27.9 | 27.9 | 27.9 | 27.9 |
| Total Cash | 58,638.4 | 195,822.8 | 259,692.8 | 198,590.8 | 202,926.4 | 203,877.3 | 249,849.6 | 306,188.2 | 375,230.5 | 459,841.2 |
| Total Cash, percent | .0 | .0 | .0 | .0 | .0 | .0 | .0 | .0 | .0 | .0 |
| Account Receivables | 14,495.3 | 17,576.5 | 15,306.2 | 11,779.8 | 10,025.7 | 16,419.7 | 20,122.2 | 24,659.5 | 30,220.0 | 37,034.3 |
| Account Receivables, % | 7.72 | 4.81 | 3.57 | 6.13 | 3.91 | 5.23 | 5.23 | 5.23 | 5.23 | 5.23 |
| Inventories | 3,541.4 | 5,927.9 | 7,689.9 | 7,190.5 | 6,939.7 | 7,380.7 | 9,044.9 | 11,084.5 | 13,583.9 | 16,647.0 |
| Inventories, % | 1.89 | 1.62 | 1.79 | 3.74 | 2.71 | 2.35 | 2.35 | 2.35 | 2.35 | 2.35 |
| Accounts Payable | 15,865.1 | 19,292.7 | 23,076.8 | 20,271.7 | 17,061.9 | 22,810.7 | 27,954.3 | 34,257.8 | 41,982.5 | 51,449.2 |
| Accounts Payable, % | 8.45 | 5.28 | 5.38 | 10.54 | 6.66 | 7.26 | 7.26 | 7.26 | 7.26 | 7.26 |
| Capital Expenditure | -7,308.2 | -10,465.7 | -11,497.5 | -16,789.8 | -28,492.2 | -18,397.4 | -22,545.9 | -27,629.8 | -33,860.0 | -41,495.1 |
| Capital Expenditure, % | -3.89 | -2.86 | -2.68 | -8.73 | -11.12 | -5.86 | -5.86 | -5.86 | -5.86 | -5.86 |
| Tax Rate, % | 26.59 | 26.59 | 26.59 | 26.59 | 26.59 | 26.59 | 26.59 | 26.59 | 26.59 | 26.59 |
| EBITAT | 14,064.4 | 100,787.4 | 123,027.7 | 28,988.4 | 46,855.1 | 61,730.6 | 75,650.2 | 92,708.6 | 113,613.4 | 139,232.1 |
| Depreciation | ||||||||||
| Changes in Account Receivables | ||||||||||
| Changes in Inventories | ||||||||||
| Changes in Accounts Payable | ||||||||||
| Capital Expenditure | ||||||||||
| UFCF | 18,133.8 | 102,507.1 | 138,155.3 | 34,768.7 | 25,838.4 | 61,601.0 | 76,599.3 | 93,871.7 | 115,038.8 | 140,978.9 |
| WACC, % | 6.71 | 6.7 | 6.65 | 6.72 | 6.74 | 6.7 | 6.7 | 6.7 | 6.7 | 6.7 |
| PV UFCF | ||||||||||
| SUM PV UFCF | 392,920.5 | |||||||||
| Long Term Growth Rate, % | 2.00 | |||||||||
| Free cash flow (T + 1) | 143,798 | |||||||||
| Terminal Value | 3,056,307 | |||||||||
| Present Terminal Value | 2,209,396 | |||||||||
| Enterprise Value | 2,602,317 | |||||||||
| Net Debt | -119,277 | |||||||||
| Equity Value | 2,721,594 | |||||||||
| Diluted Shares Outstanding, MM | 16,199 | |||||||||
| Equity Value Per Share | 168.01 |
What You Will Receive
- Genuine COSCO Financial Data: Access to historical and projected figures for precise valuation.
- Customizable Variables: Adjust WACC, tax rates, revenue growth, and capital expenditures as needed.
- Real-Time Calculations: Intrinsic value and NPV are calculated instantly.
- Scenario Simulation: Analyze various scenarios to assess COSCO’s future performance.
- Simple and User-Friendly Interface: Designed for industry professionals while remaining approachable for novices.
Key Features
- 🔍 Real-Life COSCO Financials: Pre-filled historical and projected data for COSCO SHIPPING Holdings Co., Ltd. (1919HK).
- ✏️ Fully Customizable Inputs: Adjust all critical parameters (yellow cells) such as WACC, growth %, and tax rates.
- 📊 Professional DCF Valuation: Built-in formulas calculate COSCO’s intrinsic value using the Discounted Cash Flow method.
- ⚡ Instant Results: Visualize COSCO’s valuation instantly after making adjustments.
- Scenario Analysis: Test and compare outcomes for various financial assumptions side-by-side.
How It Works
- Step 1: Download the Excel file.
- Step 2: Review COSCO SHIPPING Holdings Co., Ltd.'s pre-filled financial data and forecasts.
- Step 3: Adjust key inputs such as revenue growth, WACC, and tax rates (highlighted cells).
- Step 4: Observe the DCF model update in real-time as you modify your assumptions.
- Step 5: Evaluate the outputs and utilize the results for investment decisions regarding COSCO SHIPPING Holdings Co., Ltd. (1919HK).
Reasons to Select the COSCO SHIPPING Holdings Co., Ltd. (1919HK) Calculator
- Precision: Utilizes authentic COSCO financial data for reliable results.
- Adaptability: Built for users to easily modify and experiment with their inputs.
- Efficiency: Eliminate the complexities of creating a DCF model from the ground up.
- High-Caliber: Crafted with the accuracy and functionality expected at the CFO level.
- Intuitive: Simple to navigate, making it accessible for those without extensive financial analysis experience.
Who Can Benefit from This Product?
- Professional Investors: Create comprehensive and accurate valuation models for assessing COSCO SHIPPING Holdings Co., Ltd. (1919HK).
- Corporate Finance Teams: Evaluate various valuation scenarios to inform internal strategic decisions.
- Consultants and Advisors: Equip clients with precise valuation insights relating to COSCO SHIPPING Holdings Co., Ltd. (1919HK).
- Students and Educators: Utilize real market data to enhance the learning experience in financial modeling.
- Industry Enthusiasts: Gain a deeper understanding of how shipping companies like COSCO SHIPPING Holdings Co., Ltd. (1919HK) are valued in the marketplace.
Contents of the Template
- Comprehensive DCF Model: An editable template featuring in-depth valuation calculations.
- Real-World Data: COSCO SHIPPING Holdings Co., Ltd.'s (1919HK) historical and projected financials preloaded for thorough analysis.
- Customizable Parameters: Modify WACC, growth rates, and tax assumptions to explore different scenarios.
- Financial Statements: Complete annual and quarterly breakdowns for enhanced insights.
- Key Ratios: Integrated analysis for assessing profitability, efficiency, and leverage.
- Dashboard with Visual Outputs: Visualizations and tables that present clear, actionable results.
Disclaimer
All information, articles, and product details provided on this website are for general informational and educational purposes only. We do not claim any ownership over, nor do we intend to infringe upon, any trademarks, copyrights, logos, brand names, or other intellectual property mentioned or depicted on this site. Such intellectual property remains the property of its respective owners, and any references here are made solely for identification or informational purposes, without implying any affiliation, endorsement, or partnership.
We make no representations or warranties, express or implied, regarding the accuracy, completeness, or suitability of any content or products presented. Nothing on this website should be construed as legal, tax, investment, financial, medical, or other professional advice. In addition, no part of this site—including articles or product references—constitutes a solicitation, recommendation, endorsement, advertisement, or offer to buy or sell any securities, franchises, or other financial instruments, particularly in jurisdictions where such activity would be unlawful.
All content is of a general nature and may not address the specific circumstances of any individual or entity. It is not a substitute for professional advice or services. Any actions you take based on the information provided here are strictly at your own risk. You accept full responsibility for any decisions or outcomes arising from your use of this website and agree to release us from any liability in connection with your use of, or reliance upon, the content or products found herein.