
|
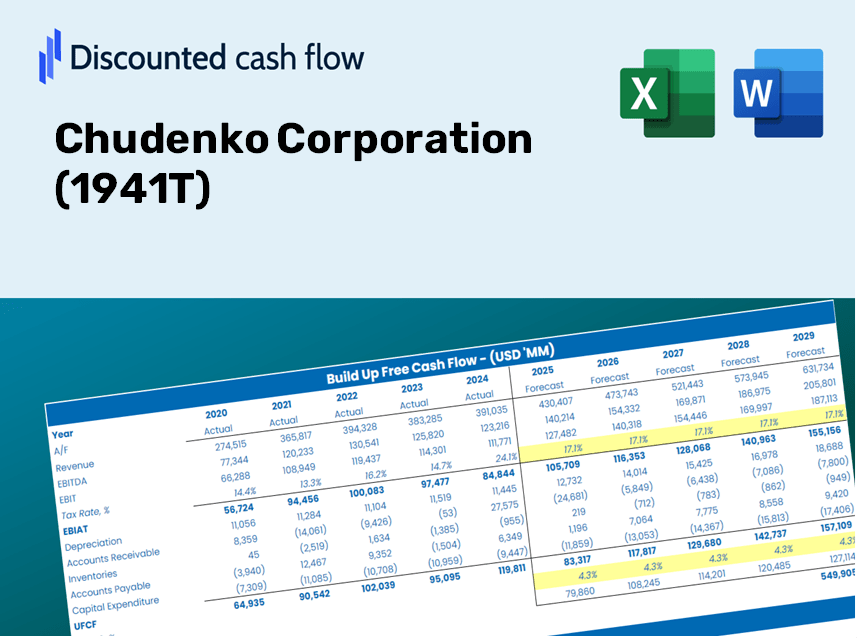
Chudenko Corporation (1941.t) DCF -Bewertung |
Fully Editable: Tailor To Your Needs In Excel Or Sheets
Professional Design: Trusted, Industry-Standard Templates
Investor-Approved Valuation Models
MAC/PC Compatible, Fully Unlocked
No Expertise Is Needed; Easy To Follow
Chudenko Corporation (1941.T) Bundle
Möchten Sie den inneren Wert der Chudenko Corporation bestimmen? Unser (1941t) DCF-Taschenrechner verwendet reale Daten und bietet umfangreiche Anpassungsoptionen, sodass Sie Ihre Prognosen verfeinern und fundiertere Investitionsentscheidungen treffen können.
Discounted Cash Flow (DCF) - (USD MM)
| Year | AY1 2021 |
AY2 2022 |
AY3 2023 |
AY4 2024 |
AY5 2025 |
FY1 2026 |
FY2 2027 |
FY3 2028 |
FY4 2029 |
FY5 2030 |
|---|---|---|---|---|---|---|---|---|---|---|
| Revenue | 184,482.0 | 190,689.0 | 189,031.0 | 201,025.0 | 221,885.0 | 232,544.8 | 243,716.8 | 255,425.5 | 267,696.7 | 280,557.5 |
| Revenue Growth, % | 0 | 3.36 | -0.86948 | 6.34 | 10.38 | 4.8 | 4.8 | 4.8 | 4.8 | 4.8 |
| EBITDA | 13,153.0 | 14,683.0 | 429.0 | 16,574.0 | 26,861.0 | 16,467.5 | 17,258.6 | 18,087.8 | 18,956.8 | 19,867.5 |
| EBITDA, % | 7.13 | 7.7 | 0.22695 | 8.24 | 12.11 | 7.08 | 7.08 | 7.08 | 7.08 | 7.08 |
| Depreciation | 3,670.0 | 3,564.0 | 3,595.0 | 3,998.0 | 4,275.0 | 4,500.0 | 4,716.2 | 4,942.8 | 5,180.3 | 5,429.2 |
| Depreciation, % | 1.99 | 1.87 | 1.9 | 1.99 | 1.93 | 1.94 | 1.94 | 1.94 | 1.94 | 1.94 |
| EBIT | 9,483.0 | 11,119.0 | -3,166.0 | 12,576.0 | 22,586.0 | 11,967.5 | 12,542.4 | 13,145.0 | 13,776.5 | 14,438.3 |
| EBIT, % | 5.14 | 5.83 | -1.67 | 6.26 | 10.18 | 5.15 | 5.15 | 5.15 | 5.15 | 5.15 |
| Total Cash | 37,771.0 | 35,058.0 | 37,030.0 | 36,335.0 | 42,337.0 | 44,464.4 | 46,600.5 | 48,839.3 | 51,185.7 | 53,644.7 |
| Total Cash, percent | .0 | .0 | .0 | .0 | .0 | .0 | .0 | .0 | .0 | .0 |
| Account Receivables | 57,083.0 | 65,728.0 | 66,395.0 | 70,612.0 | 71,242.0 | 78,027.4 | 81,776.0 | 85,704.7 | 89,822.1 | 94,137.4 |
| Account Receivables, % | 30.94 | 34.47 | 35.12 | 35.13 | 32.11 | 33.55 | 33.55 | 33.55 | 33.55 | 33.55 |
| Inventories | 10,913.0 | 11,744.0 | 13,206.0 | 12,381.0 | 12,453.0 | 14,339.5 | 15,028.4 | 15,750.4 | 16,507.1 | 17,300.1 |
| Inventories, % | 5.92 | 6.16 | 6.99 | 6.16 | 5.61 | 6.17 | 6.17 | 6.17 | 6.17 | 6.17 |
| Accounts Payable | 32,618.0 | 37,272.0 | 34,423.0 | 36,973.0 | 36,283.0 | 41,942.5 | 43,957.5 | 46,069.3 | 48,282.6 | 50,602.2 |
| Accounts Payable, % | 17.68 | 19.55 | 18.21 | 18.39 | 16.35 | 18.04 | 18.04 | 18.04 | 18.04 | 18.04 |
| Capital Expenditure | -1,470.0 | -1,666.0 | -4,080.0 | -3,377.0 | -5,534.0 | -3,722.0 | -3,900.9 | -4,088.3 | -4,284.7 | -4,490.5 |
| Capital Expenditure, % | -0.79683 | -0.87367 | -2.16 | -1.68 | -2.49 | -1.6 | -1.6 | -1.6 | -1.6 | -1.6 |
| Tax Rate, % | 11.91 | 11.91 | 11.91 | 11.91 | 11.91 | 11.91 | 11.91 | 11.91 | 11.91 | 11.91 |
| EBITAT | 6,006.6 | 6,682.0 | -6,897.7 | 7,939.5 | 19,895.9 | 8,967.4 | 9,398.2 | 9,849.7 | 10,322.9 | 10,818.9 |
| Depreciation | ||||||||||
| Changes in Account Receivables | ||||||||||
| Changes in Inventories | ||||||||||
| Changes in Accounts Payable | ||||||||||
| Capital Expenditure | ||||||||||
| UFCF | -27,171.4 | 3,758.0 | -12,360.7 | 7,718.5 | 17,244.9 | 6,733.0 | 7,791.1 | 8,165.4 | 8,557.7 | 8,968.8 |
| WACC, % | 4.53 | 4.53 | 4.53 | 4.53 | 4.53 | 4.53 | 4.53 | 4.53 | 4.53 | 4.53 |
| PV UFCF | ||||||||||
| SUM PV UFCF | 35,075.7 | |||||||||
| Long Term Growth Rate, % | 2.00 | |||||||||
| Free cash flow (T + 1) | 9,148 | |||||||||
| Terminal Value | 361,622 | |||||||||
| Present Terminal Value | 289,771 | |||||||||
| Enterprise Value | 324,847 | |||||||||
| Net Debt | -27,264 | |||||||||
| Equity Value | 352,111 | |||||||||
| Diluted Shares Outstanding, MM | 54 | |||||||||
| Equity Value Per Share | 6,490.20 |
What You Will Receive
- Adjustable Forecast Parameters: Effortlessly modify key assumptions (growth %, margins, WACC) to explore various scenarios.
- Comprehensive Data: Chudenko Corporation’s financial data pre-populated to facilitate your analysis.
- Automated DCF Calculations: The template automatically computes Net Present Value (NPV) and intrinsic value.
- Versatile and Professional Design: A refined Excel model tailored to meet your valuation requirements.
- Designed for Analysts and Investors: Perfect for assessing projections, confirming strategies, and enhancing efficiency.
Key Features
- Comprehensive Chudenko Data: Includes pre-filled historical financials and future projections for Chudenko Corporation (1941T).
- Customizable Variables: Modify input parameters such as revenue growth, profit margins, WACC, tax rates, and capital expenses.
- Adaptive Valuation Model: Automatically refreshes Net Present Value (NPV) and intrinsic value in response to your adjustments.
- Scenario Analysis: Develop various forecasting scenarios to evaluate different valuation results.
- Intuitive Interface: Designed to be straightforward and accessible for both seasoned professionals and newcomers.
How It Functions
- Step 1: Download the Excel spreadsheet.
- Step 2: Examine Chudenko Corporation’s (1941T) pre-filled financial metrics and projections.
- Step 3: Adjust essential variables such as revenue growth, WACC, and tax rates (highlighted cells).
- Step 4: Observe the DCF model refresh in real-time as you modify your assumptions.
- Step 5: Evaluate the results and leverage the findings for investment strategies.
Why Select the Chudenko Corporation (1941T) Calculator?
- Precision: Trustworthy Chudenko financial data guarantees accuracy.
- Adaptability: Tailored for users to easily experiment with and adjust inputs.
- Efficiency: Eliminate the complexity of creating a DCF model from the ground up.
- Expert-Level: Crafted with the insight and usability expected by CFOs.
- Intuitive: Simple to navigate, even for those with minimal financial modeling knowledge.
Who Can Benefit from This Product?
- Investors: Accurately assess Chudenko Corporation’s (1941T) fair value to inform investment choices.
- CFOs: Utilize a top-tier DCF model for comprehensive financial reporting and analysis.
- Consultants: Effortlessly customize the template for client valuation reports.
- Entrepreneurs: Discover financial modeling techniques employed by leading companies.
- Educators: Implement this resource as a teaching aid to illustrate valuation methods.
Contents of the Template
- Historical Data: Features Chudenko Corporation’s (1941T) previous financial performance and foundational forecasts.
- DCF and Levered DCF Models: Comprehensive templates for assessing the intrinsic value of Chudenko Corporation (1941T).
- WACC Sheet: Ready-to-use calculations for Weighted Average Cost of Capital.
- Editable Inputs: Adjust critical variables such as growth rates, EBITDA %, and CAPEX assumptions.
- Quarterly and Annual Statements: An exhaustive overview of Chudenko Corporation’s (1941T) financials.
- Interactive Dashboard: Dynamically visualize valuation outcomes and projections.
Disclaimer
All information, articles, and product details provided on this website are for general informational and educational purposes only. We do not claim any ownership over, nor do we intend to infringe upon, any trademarks, copyrights, logos, brand names, or other intellectual property mentioned or depicted on this site. Such intellectual property remains the property of its respective owners, and any references here are made solely for identification or informational purposes, without implying any affiliation, endorsement, or partnership.
We make no representations or warranties, express or implied, regarding the accuracy, completeness, or suitability of any content or products presented. Nothing on this website should be construed as legal, tax, investment, financial, medical, or other professional advice. In addition, no part of this site—including articles or product references—constitutes a solicitation, recommendation, endorsement, advertisement, or offer to buy or sell any securities, franchises, or other financial instruments, particularly in jurisdictions where such activity would be unlawful.
All content is of a general nature and may not address the specific circumstances of any individual or entity. It is not a substitute for professional advice or services. Any actions you take based on the information provided here are strictly at your own risk. You accept full responsibility for any decisions or outcomes arising from your use of this website and agree to release us from any liability in connection with your use of, or reliance upon, the content or products found herein.